Tutorials
Looking to improve your data skills using tools like R or Python? Want to learn more about working with a specific NEON data product? NEON develops online tutorials to help you improve your research. These self-paced tutorials are designed for you to used as standalone help on a single topic or as a series to learn new techniques.
Code for most script based tutorials can be downloaded at the end of the tutorial. Source files can also be found on GitHub. If you are interested in contributing a tutorial to this collection, please reach out using the Contact Us form, and we can guide you through the process of submitting resources to the GitHub repository.
All materials are freely available for you to use and reuse. We suggest the following citation for tutorials: [AUTHOR(S), NEON (National Ecological Observatory Network)]. Data Tutorial: [TUTORIAL NAME]. [URL] (accessed [DATE OF ACCESS]). See Citation Guidelines for examples, and for guidance in citing data and code.
Tutorials
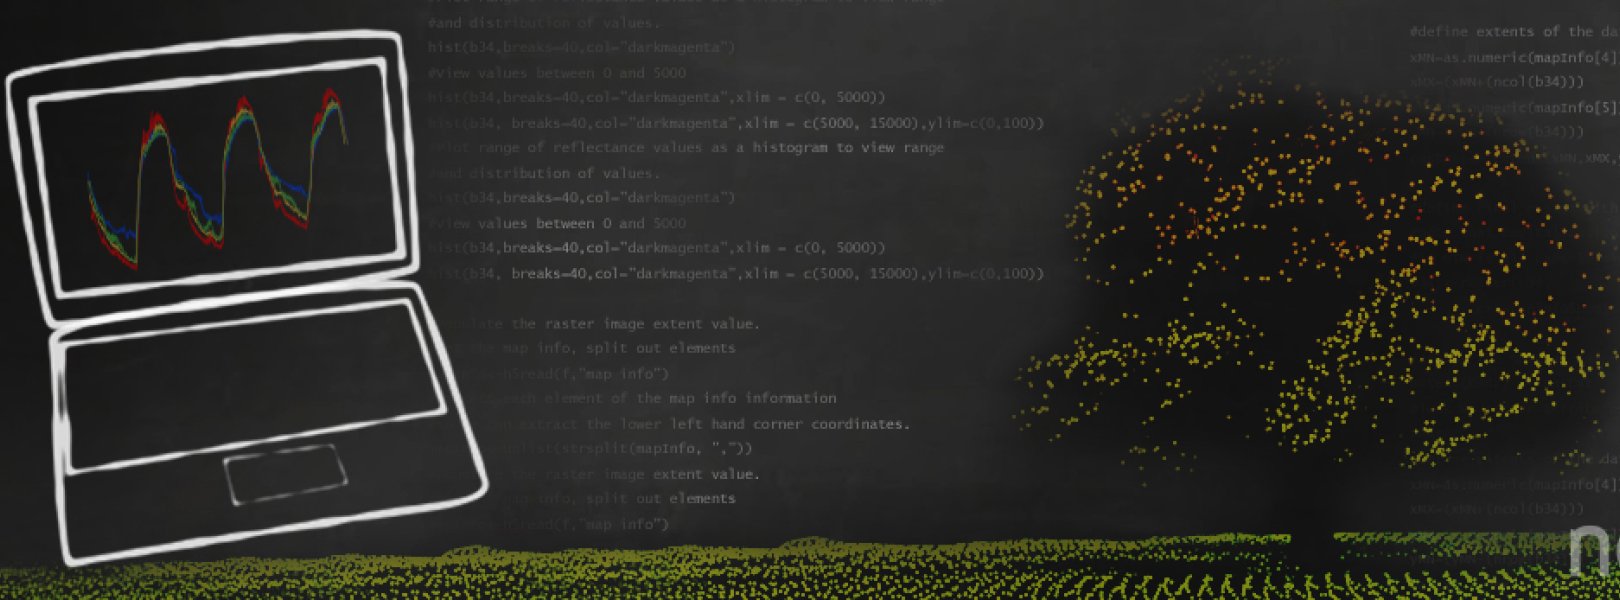
Image Raster Data in R - An Intro
|
Install & Set Up Docker For Use With eddy4R
|
Install Git, Bash Shell, Python
|
Install Git, Bash Shell, R & RStudio
|
Install QGIS & HDF5View
|
Installing & Updating Packages in R
|
Interacting with the PhenoCam Server using phenocamapi R Package
|
Interactive Data Vizualization with R and Plotly
|
Intro to AOP Data in Google Earth Engine (GEE) Tutorial Series
|
Intro to AOP Datasets in Google Earth Engine (GEE) using Python
|
Intro to AOP Hyperspectral Data in Google Earth Engine (GEE) using Python geemap
|
Intro to Vector Data in R
|
Intro to Working with Hyperspectral Remote Sensing Data in HDF5 Format in R
|
Introduction to AOP Public Datasets in Google Earth Engine (GEE)
|
Introduction to Bidirectional Hyperspectral Reflectance Data in Python
|
Introduction to HDF5 Files in R
|
Introduction to Hierarchical Data Format (HDF5) - Using HDFView and R
|
Introduction to Hyperspectral Remote Sensing Data in Python
This series covers how to: - Open hyperspectral reflectance data stored in HDF5 format in Python - Read in and explore the data and metadata contents - Extract and plot a single reflectance band and RGB and false-color band combinations - Read in and plot the spectral signature of a single pixel - Interactively plot the spectral signature of various pixels within a reflectance tile Data used in this series are from the National Ecological Observatory Network (NEON) and are in HDF5 format. |
Introduction to Hyperspectral Remote Sensing Data in R
Finally we demonstrate how to extract a spectral signature from a single pixel using R, and show how to interactively compare spectra from different land cover types. |
Introduction to Light Detection and Ranging (LiDAR) in R
|
Introduction to NEON API in Python
|
Introduction to NEON Discrete Lidar Data in Python
|
Introduction to NEON soil sensor data
|
Introduction to Small Mammal Data
|
Introduction to the National Ecological Observatory Network (NEON)
|
Introduction to using Jupyter Notebooks
|
Introduction to working with NEON eddy flux data
|
Introduction to working with PhenoCam Images
|
Introduction to Working with Raster Data in R
|
Introduction to Working With Time Series Data in Text Formats in R
|