Getting Started with NEON Data

About NEON Data
NEON generates standardized and quality-controlled data products including meteorological, soil, organismal, biogeochemical, freshwater aquatic, and remote sensing data. Data are collected at 81 aquatic and terrestrial field sites across the U.S. using automated instruments, observational field sampling, and airborne remote sensing surveys. For more information, explore Data and Sample Collection Methods.
As a U.S. National Science Foundation facility, NEON data products are freely available online. Once data are collected in the field, they are processed, published, and made available from the NEON Data Portal. All data come with data collection and processing documentation. Data used in publications should be cited; see Citation Guidelines.
The following sections are intended to help guide you through learning about what data are available, how to explore data products with the NEON Data Portal, and how to start working with NEON data in your own R or Python environment. We recommend three steps, which we detail below and provide resources for: 1) Learn about NEON data, 2) Explore the Data Portal and Data Availability, and 3) Learn to Work with Data.
1. Learn about NEON
NEON's Vision, History, and Design
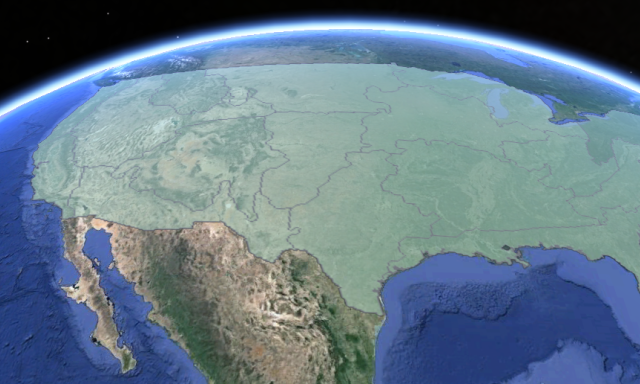
NEON provides continental-scale data across the US that characterize and quantify complex, rapidly changing ecological processes. Learn more about its vision, history, and design.
What NEON Monitors, and How
NEON collects data and samples using an extensive network of thousands of automated instruments and hundreds of field technicians, as well as though airborne remote sensing.

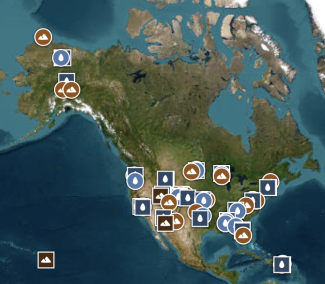
Explore the Field Sites
Explore where data and samples are collected across the United States.
2. Explore the Data Portal and Data Availability
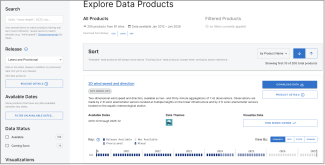
Explore Data Products
Explore the full listing of data products that NEON provides through our interactive application.
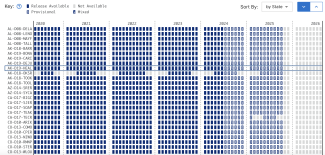
Check Availability
Check for data products by region and time block through the Data Availability Charts. You can search by site or by product.
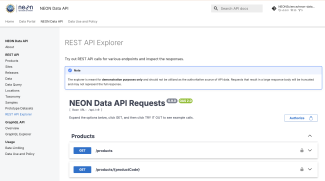
Data API
Learn how to programmatically explore information about the products and download data from NEON's API.
Visual Guide
This presentation provides a step-by-step overview of how to access and download NEON data from the NEON Data Portal.
Data Portal Webinar
In this recorded webinar, participants are led through the NEON website and NEON data portal to learn about currently available online resources and how to download NEON data.
3. Learn to Work with Data
Data Skills Tutorials
NEON maintains hundreds of free, online, self-paced training tutorials to teach users how to work with NEON data. Try Get Started with NEON Data: A Series of Data Tutorials or use the link below to browse them all.
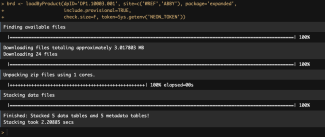
Use neonUtilities in R or Python
The neonUtilities R package (direct installation available through CRAN) offers the most rapid, easy way to download and prepare data for analysis. The neonutilities package is also available in Python.
Code Resources
The Code Hub is an index of open code resources, developed by NEON staff or end users to make working with NEON data easier and perform useful algorithms on select data products.

Other Resources
There are many resources and tools on the NEON website. Please dig in, explore the portal, use NEON data, and if you don't see what you are looking for, we encourage you to send in feedback and requests to NEON.