Site Level Sampling Design
All aquatic field sites are designed to use the full extent of the permitted area for sampling and observations, encompassing organismal, community, morphological, and biogeochemical metrics and interactions. At each terrestrial field site, a spatially-balanced sampling design is used to establish observational sampling plots that support site-wide characterization of organismal, community, and biogeochemical dynamics.
Aquatic Field Site Sampling Designs
NEON collects data at 34 aquatic sites, including 24 wadeable streams, 7 lakes, and 3 non-wadeable rivers that are located within 19 of the 20 Domains (D20, Hawaii, does not have an aquatic site). Aquatic sites were chosen with representative features, habitats, and ecological properties in the United States within each NEON Domain. NEON classifies streams as stretches of lotic water that are safely wadeable during most, if not all, of the year. Rivers are classified as stretches of flowing water that are not often, if ever, safely wadeable. Lakes are classified as lentic bodies of water that may or may not stratify depending on meteorological and hydrologic conditions during the year.
| Observation Type | Streams | Lakes | Rivers | Groundwater* |
|---|---|---|---|---|
| Discharge | up to 24 | up to 12 | ||
| Reaeration | 6 | |||
| Rapid Habitat Assessment | 1 | |||
| Morphology | 1 per 5 years | |||
| Bathymetry | 1 per 5 years | 1 | ||
| Aquatic Plants | 3 | 3 | 3 | |
| Macroinvertebrates | 3 | 3 | 3 | |
| Zooplankton | 3 | |||
| Periphyton and Phytoplankton | 3 | 3 | 3 | |
| Benthic Microbes | 3 | |||
| Surface Water Microbes | 12 | 6 | 6 | |
| Fish | 2† | 2 | ||
| Riparian Assessment | 1 | 1 | 1 | |
| Water Chemistry | 26 | 12 | 26 | 2 |
| Dissolved Gas in Water | 26 | 12 | 26 | |
| Stable Isotopes | 26 | 12 | 26 | 2 |
| Sediment Chemistry | 2 | 2 | 2 |
* There are no groundwater wells at CUPE, LECO, MCRA, or TECR. Fish are not sampled at D13 Como Creek (COMO) anytime or during bout 1 at D16 Martha Creek (MART) and McRae Creek (MCRA).
AOS sampling takes place in and adjacent to water bodies at the NEON aquatic sites, similar to the AIS design that encompasses both riparian, water surface, shallow groundwater, and in situ aquatic sensor measurements. To quantify locational variance and heterogeneity of landscape-scale ecological processes at each NEON aquatic site, the AOS spatial design uses the same location for measuring physical and chemical variables while allowing flexibility in identifying representative habitat (i.e., riffle, run, or pool) for biological sampling at locations that can vary over time. AOS sampling is distributed throughout the stream, lake, or river reach in a manner that attempts to prevent interference but maximize linkages and extrapolation with other AIS and AOS operations . For example, water chemistry sampling in a wadeable stream occurs immediately downstream of the sensor set to allow for comparisons between grab samples and sensor measurements and avoid suspending sediment from foot traffic that may affect sensor measurements. Boats and/or other infrastructure are used to facilitate sampling at rivers and lakes near buoys and other infrastructure equipped with AIS sensors.
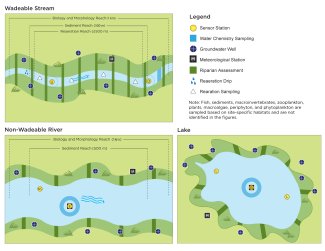
Schematics showing spatial placement of automated instruments at stream, river and lake sites.
NEON aquatic sites represent a vast range of patterns in precipitation, discharge, vegetation, temperature, and light, which requires an AOS temporal sampling strategy based on local drivers of variability. Specifically, hydrologic, climatic, and biological metrics derived from historical data are used to determine the site-specific timing of AOS sampling at each NEON aquatic site and are described in the Aquatic Site Sampling Design Documents (download link below) and in the NEON Aquatic Sampling Strategy document.
Terrestrial Observations Sampling Design
NEON collects data at 47 terrestrial sites across 20 ecoclimatic Domains. These sites were nominated by the ecological research community, are broadly representative of within-domain ecoclimatic variability, and are suitable for long-term, intensive sampling. The within-site sampling design uses a spatially-balanced framework to assign sampling locations. Many of the specific locations (plots) involved in Terrestrial Observational Sampling (TOS) are collocated with each other and with environmental sensors (i.e., within the footprint of the flux tower) to allow comparison of different data streams (see figure below).To generate site-level observations and to integrate plot-level data with NEON tower data, TOS sampling occurs primarily within two different plot types, Distributed and Tower.
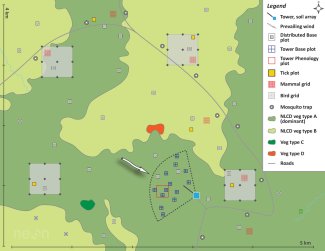
Terrestrial Observational Sampling Spatial layout with Legend
Distributed Plots
Distributed Plots are established to describe organisms and processes at the scale of the site, and are allocated according to a stratified-random and spatially balanced design in an effort to collect data from locations distributed throughout the dominant NLCD vegetation types. For most TOS data products generated from Distributed plots, sampling is allocated proportional to NLCD area. This design allows end-users to calculate the site-level mean for parameters of interest using simple averages. Distributed plots are established either as ‘base’ plots that support multiple TOS protocols, or as protocol-specific point and grid locations that are adjacent to base plots (see figure above). A maximum of 30 Distributed base plots is established at a site, and some sites may have fewer for logistical reasons (e.g., small site area). Plant Diversity sampling occurs in all Distributed base plots, and collocation of plant and soil sampling occurs in a subset of these plots to maximize the scientific value of these data streams. Ground beetle sampling takes place within a subset of Distributed base plots, and sampling for mosquitoes, ticks, birds, and small mammals is implemented at protocol-specific sampling locations adjacent to a subset of the Distributed base plots that also support beetle sampling (see figure above). There are additional constraints on mosquito and small mammal sampling locations which must be relatively close to roads for logistical reasons.
Tower Plots
Tower Plots provide a direct link between NEON’s terrestrial observations and the instrument systems. These plots are located within the NEON tower footprint, generally in the dominant vegetation type, and locations are determined according to a spatially balanced, random design. This sampling design ensures that end-users may readily calculate mean values of parameters of interest using simple averages. Measurements include above and below- ground plant productivity and biomass, plant diversity, plant phenology, soil biogeochemistry, and soil microbial community diversity and abundance. Tower plots are either 20 x 20 m or 40 x 40 m, depending on the stature of vegetation - except for the phenology observation loop which is 200 x 200 m.
The number of TOS locations sampled varies by measurement type and relates to the predicted level of effort needed to describe local patterns and detect change over time (see table below). Data collected over the first several years of observations is helping to define the variability in different TOS measurements, and thus the sampling intensity and frequency required. The within-site study design has thus been evolving to some extent to balance scientific insights with efficient allocation of resources, and optimization efforts will continue as more data become available.
| Plot Type | Plot Sub-Type | Protocol | Plot Number | Sampling Interval (years) |
|---|---|---|---|---|
| Distributed | Base Plot | Canopy Foliage Sampling | variable | 5 |
| Distributed | Base Plot | Coarse Downed Wood | 20 (max) | 5 |
| Distributed | Base Plot | Ground Beetle Sampling | 10 | annual |
| Distributed | Base Plot | Herbaceous Biomass and Productivity | 20 (max) | 5 |
| Distributed | Base Plot | Leaf Area Index | 20 (max) | 5 |
| Distributed | Base Plot | Plant Diversity | 30 (max) | annual |
| Distributed | Base Plot | Soil Biogeochemical and Microbial Sampling | 6 | annual or every 5y* |
| Distributed | Base Plot | Vegetation Structure | 20 (max) | 5 |
| Distributed | Bird Grid | Breeding Landbird Abundance and Diversity | 5 - 10† | annual |
| Distributed | Mammal Grid | Small Mammal Sampling | 3 - 8 | annual |
| Distributed | Mosquito Point | Mosquito Sampling | 10 | annual |
| Distributed | Tick Plot | Tick and Tick-borne Pathogen Sampling | 6 | annual |
| Distributed | Base Plot | Plant Belowground Biomass | 20 or 30 | 5 |
| Tower | Base Plot | Canopy Foliage Sampling | variable | 5 |
| Tower | Base Plot | Coarse Downed Wood | 20 or 30 | 5 |
| Tower | Base Plot | Herbaceous Biomass and Productivity | 20 or 30 | annual |
| Tower | Base Plot | Leaf Area Index | 3 | annual |
| Tower | Base Plot | Litterfall | 20 or 30 | annual |
| Tower | Base Plot | Plant Diversity | 3 | annual |
| Tower | Base Plot | Soil Biogeochemical and Microbial Sampling | 4 | annual or every 5 y* |
| Tower | Base Plot | Vegetation Structure | 20 or 30 | annual or every 5 y‡ |
| Tower | Phenology Loop‡ | Plant Phenology | 1 | annual |
| Tower | Phenocam‡ | Plant Phenology | 1 | annual |
* Soil microbial community composition and biomass are sampled annually at core sites and every 5 years at gradient-type sites. Soil chemistry and net N transformation rates are sampled every 5 y regardless of site type.
† Breeding landbirds are sampled in grids at large sites; otherwise they are sampled at up to 25 Distributed Base Plots.
‡ A representative subset of plots are sampled annually and all plots are sampled every 5 years.
More detailed information about the sampling design of different TOS measurement types can be found on specific Observational Types web pages, in the sampling protocols and data product user guides within the Data Portal Document Library, and the NEON TOS Spatial and Temporal Sampling Strategy document.