Sample Quality
NEON curates and archives high-quality samples for use by the ecological community.
History
NEON has been collecting specimens as part of its sampling program since 2012. Certain samples are earmarked for immediate curation at an archival institution, while others are sent to analytical facilities for chemical, taxonomic or genetic analysis. Where possible, the downstream byproducts of these analyses are archived in lieu of the original sample (e.g., when ear tissue from small mammal collections are sent for genetic analysis, any surplus genomic extracts are preserved at an archive facility).
In 2018, NEON began construction of the NEON Biorepository – a facility intended to archive most specimens curated by the NEON program. Over 100,000 samples collected between 2012 and 2018 are available for loan from the NEON Biorepository (located in Tempe, AZ at the ASU Natural History Collections). Although the NEON Biorepository is the primary facility housing NEON samples, select specimens collected before the NEON Biorepository was operational are held by other institutions. NEON also archives samples at other institutions in accordance with permitting requirements (e.g., Hawaiian specimens archived at the Bishop Museum).
A subset of samples collected during construction were not subjected to the current operational quality assurance and quality control procedures. For example, early samples were marked with handwritten labels instead of barcodes or curated in non-archival containers (soils archived in Whirl Pak containers at -80 ˚C versus cryovials in vapor-phase liquid nitrogen). As NEON continues in its early operational phase, sample QA/QC procedures will continue to be refined and revised. Input from the user community is both solicited and encouraged. Formal input is encouraged through our technical working groups. Informal feedback can be contributed through our contact page.
Sample Quality Program
The quality strategy for Observation System (OS) samples is focused on (1) controlling and validating data entry and (2) ensuring appropriate transfer of samples with needed metadata. The Instrument System (IS) generates only a handful of sample types (associated with the wet deposition and dust mass data products), but these are handled in the same way that OS samples are handled.
Sample Identification and Labeling
Every sample is identified in the NEON database with a unique primary key, comprised of a Sample Tag, a Barcode, and a Sample Class. A Sample Tag is the identifier for the sample and contains as much information as is required to differentiate specimens within the same sample class; these identifiers may contain information about the sample encoded in the label, including the site or plot of collection, the date or time of collection, the taxon or sex (as applicable), or a unique number (e.g., tag number from a PIT tag on a small mammal). Specimens collected in early operations had these sample identifiers printed or written on the specimen container; as the observatory has moved into operations, these written labels have been supplemented and/or replaced by barcodes. These Sample Tags are still present in the database even where they have been supplanted by barcodes.
Barcode labels were first used on NEON samples in 2017 on a select number of NEON specimens and expanded to most NEON sample types in subsequent years. NEON uses cryo-compatible barcode labels for specimens stored in -20 to -196 ˚C and non-cryo barcode labels for the remaining samples. The non-cryo labels are robust to exposure in solvents (particularly ethanol and water) and are optimized to hold up to field conditions. NEON is currently working with its external laboratories to implement barcode usage wherever possible. In the NEON Processed Data Repository (PDR), barcodes cannot be duplicated – as in, two separate/different samples cannot be affiliated with the same barcode. This enables NEON to leverage barcode tracking for duplicate checking in the database.
Sample classes roughly equate to types of samples, such that carabid specimens mounted on pins (sample class: bet_IDandpinning_in.individualID) have a different class than mounted mosquito specimens (mos_identification_in.individualIDList). The first part of the sample class name identifies the data table that is input into NEON's database, e.g., bet = beetle, IDandpinning = identification and pinning activity, in = ingest. The second part of the sample class name identifies the specific field in the table that holds identifiers.
Tracking and Finding Samples
NEON collects and archives up to 120,000 samples per year at the NEON Biorepository. Additional samples are collected for destructive analysis at the NEON Domain Support Facilities or external laboratories. To track samples moving between facilities, NEON generates shipment manifests and standardized receipt forms that enable NEON to track the location of a sample through its lifetime from generation in the field to final disposition. Because of the use of barcodes and autogenerated shipment manifests, NEON has greatly reduced opportunity for transcription errors associated with labels and sample transfer. A sample's custody and location history, as well as relationships to other samples (parent, child, and siblings) can be explored using the Sample Viewer.
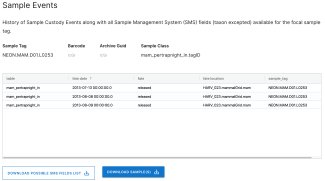
Sample search results for NEON.MAM.D01.L0253; this sample appears in the trapping data repeatedly reflecting that it was captured on multiple occasions.
The NEON Sample Viewer also allows users to explore the relationship between a sample from the field and all downstream subsamples and mixtures. For example, a female Peromyscus leucopus (NEON.MAM.D01.L0253) was captured at the HARV site in 2013 on multiple dates. Using this tool, a user can see all subsamples from this mammal – in this case 3 fecal samples, 2 blood samples, 2 hair samples, and 1 ear tissue collection.
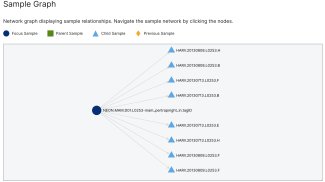
Sample graph showing 8 subsamples (ear, hair, blood, feces) collected from small mammal NEON.MAM.D01.L0253.