Surface Water

Collecting measurements on chemical and physical properties of surface water is necessary to determine how aquatic and terrestrial ecosystems respond to hydrologic changes. Surface water elevation can be linked to the depth of water in a stream or river, or to the volume of water in a lake. Stream discharge controls the movement of water, solutes, and sediments through lotic (flowing water) ecosystems.
Both the water level and the frequency of floods and droughts (hydroperiod) are critical controls on aquatic ecosystems. Physical scouring of plants and animals living on the stream bed often occurs during high flows, while deposition of transported debris, such as log jams, can create new habitat. Conversely, low flows and low water levels can sometimes create disconnected pools. Higher flows often impact water chemistry by delivering pulses of carbon and nutrients from upstream and the surrounding environment, including terrestrial derived material that gets washed into the stream.
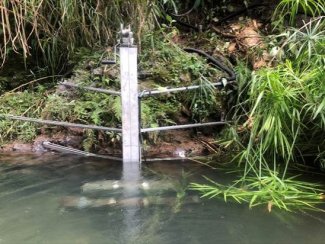
At D04 GUIL, SUNA and Sonde water quality sensors are deployed using a vertical I-beam that is attached to a bedrock outcrop along the bank
At lakes and river sites, water temperature profiles indicate if a system is thermally stratified. Because water density is a function of temperature, bodies of water can become separated into two or more layers based on temperature. Typically, in a thermally stratified system, the top layer of water is warmer (epilimnion) while the lower layer is colder (hypolimnion). The area separating the two layers is known as the thermocline or metalimnion. Water chemistry and aquatic communities are highly dependent on water temperature, and thermal stratification can dramatically change the water chemistry and biology of each layer. At lake and river sites, data on water temperature and chemistry is collected from multiple depths if the water body is at least 2 m deep in order to understand the changes through the vertical water column.
Photosynthetically active radiation (PAR) is light within the range used for photosynthesis (around 400 nm to 700 nm). Photosynthesis, the process by which autotrophs (e.g., plants and algae) convert solar energy into chemical energy, is critical to most life on Earth. Photosynthesis, and its inverse process respiration, drive many chemical, physical, and biological processes, including the global carbon cycle.
Rates of photosynthesis and respiration in aquatic ecosystems can be estimated from daily changes in dissolved oxygen (DO). If consumption of DO by respiration exceeds production by photosynthesis, concentrations can become depleted, resulting in a condition known as hypoxia. As animals require oxygen to breathe, this can result in negative ecological consequences such as fish kills. By measuring PAR, DO, and other variables, we can understand how these metabolic processes are affected by variation in light caused by season, canopy phenology, or water column attenuation by turbidity, as well as other drivers such as hydrology, temperature and nutrients.
Turbidity is an optical characteristic indicating the amount of light that is scattered by particles suspended in the water. It is often described as the "cloudiness." Turbidity is highly responsive to hydrologic cycles and oftentimes increases as stormwater runoff caries sediments into streams and lakes. Increased turbidity can result from changes in land use and is often used as a general indicator of water pollution. When turbidity is high, light is less able to penetrate the water body which can adversely affect productivity. When the sediment settles, it can also damage aquatic habitat.
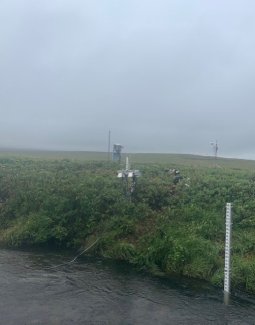
At the Domain 18 OKSR field site, SUNA and Sonde water quality sensors are mounted just above the streambed in a low-profile manner to prevent damage due to bedload, debris, and ice. The Level TROLL pressure transducer is mounted at the streambed near the staff gauge to minimize any disruption of the sensor elevation over time.
Nitrogen is a major nutrient and a potential limiting element controlling rates of plant growth in some aquatic ecosystems. Nitrate is a common form of inorganic nitrogen, and measurements in aquatic systems are critical to understanding the biogeochemical cycle and mechanisms in the ecosystem. Monitoring nitrate is important because changes in concentration over time may be an indication of increasing pollution from fertilizer runoff or sewage. Loading of excess nutrients such as nitrate can potentially cause negative ecological consequences such as excessive plant growth and harmful algal blooms.
Grab samples and sensor-based measurements are collected at all NEON aquatic field sites. These measurements are used to understand hydrologic variation and how aquatic ecosystems change in response to seasonal and daily cycles. Sampling locations and the placement of sensor stations and data collected varies between stream, river, and lake sites. Surface water measurements can be linked with meteorological station and groundwater well data to better understand interactions between surface water, the atmosphere, and groundwater.
Sampling Design and Methods
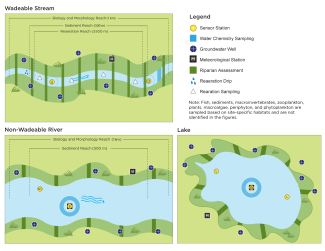
Schematics showing spatial placement of automated instruments at stream, river and lake sites.
At stream sites, two sensor stations are installed a maximum of 400 m from each other within the sampling reach. The precise placement of each station is based on geomorphologic and hydrologic characteristics (i.e., discharge, velocity values, and travel times). These stations collect surface water chemical and physical properties data.
At river sites, a buoy-mounted sensor station is placed in the channel, outside of the main navigational channel, to collect chemical and physical properties of the water at the surface and at multiple depths. An additional sensor station is installed near the shore of the river to collect underwater PAR and surface water elevation.
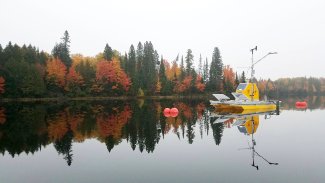
Crampton Lake (CRAM): Buoys at lake and river sites are outfitted with an above water meteorological station and surface water sensors.
At lake sites, a buoy-mounted sensor station is placed in the deepest location of the main basin to collect chemical and physical properties of the water at the surface and at multiple depths. Additional sensor stations are placed in the littoral (nearshore) area where sunlight penetrates the water to the lake bottom. These littoral sensor stations of the lake collect PAR and surface water elevation. At Toolik Lake, the only NEON lake site with a perennial inflow and outflow, two additional sensor stations are located in the inflow and outflow channels that measure surface water temperature, pressure, and conductivity.
List of Sensors
| Manufacturer | Model | Parameters Measured |
|---|---|---|
| YSI/XYLEM | EXO2 | Conductivity, Dissolved oxygen, pH, chlorophyll-a, turbidity, fluorescent dissolved organic matter |
| SeaBird | SUNA V2 | Nitrate |
| Thermometrics | PRT | Water temperature |
| YSI/XYLEM | 201043 | Water temperature at specific depths (lakes) |
| In-situ | LevelTroll 500 | Water depth |
| In-situ | AquaTroll 200 | Groundwater depth, temperature and conductivity |
| Kipp Zonen | PQS1 | Photosynthetically active radiation |
| Li-COR | LI192SA | Underwater photosynthetically active radiation |
| Hukseflux | NRO1 | Long- and short-wave radiation |
| NovaLynx | WindObserver II | 2-D Wind speed and direction |
| Vaisala | PTB330 | Barometric Pressure |
| Thermometrics | PRT | Single point aspirated air temperature |
Data Products
Instrument derived surface water products:
- Elevation of surface water (DP1.20016.001)
- Gauge Height (DP1.20267.001)
- Stream discharge rating curve (DP4.00133.001)
- Stream discharge (DP4.00130.001)
- Water quality (DP1.20288.001)
- Temperature (PRT) in surface water (DP1.20053.001)
- Temperature at specific depth in surface water (DP1.20264.001)
- Nitrate in surface water (DP1.20033.001)
- Photosynthetically active radiation below water surface (DP1.20261.001)
- Land-water interface images (DP1.20002.001)
Surface water grab samples are collected at the downstream sensor station for wadeable streams, and near the buoy for rivers and lakes. These include:
- Chemical properties of surface water (DP1.20093.001)
- Dissolved gasses in surface water (DP1.20097.001)
- Stable isotopes in surface water (DP1.20206.001)
- Salt-based stream discharge (DP1.20193.001)
- Surface water microbe cell count (DP1.20138.001)
- Surface water microbe marker gene sequences (DP1.20282.001)
- Surface water microbe metagenome sequences (DP1.20281.001)
- Surface water microbe group abundances (DP1.20278.001)
- Surface water microbe community composition (DP1.20141.001)