NSF NEON | Open Data to Understand our Ecosystems logo

Main navigation

  • About Us
    • Overview
      • Spatial and Temporal Design
      • History
    • Vision and Management
    • Advisory Groups
      • Advisory Committee: STEAC
      • Technical Working Groups (TWGs)
    • FAQ
    • Contact Us
      • Field Offices
    • User Accounts
    • Staff

    About Us

  • Data & Samples
    • Data Portal
      • Explore Data Products
      • Data Availability Charts
      • Spatial Data & Maps
      • Document Library
      • API & GraphQL
      • Prototype Data
      • External Lab Data Ingest (restricted)
    • Samples & Specimens
      • Discover and Use NEON Samples
        • Sample Types
        • Sample Repositories
        • Sample Explorer
        • Megapit and Distributed Initial Characterization Soil Archives
        • Excess Samples
      • Sample Processing
      • Sample Quality
      • Taxonomic Lists
    • Collection Methods
      • Protocols & Standardized Methods
      • AIrborne Remote Sensing
        • Flight Box Design
        • Flight Schedules and Coverage
        • Daily Flight Reports
        • Camera
        • Imaging Spectrometer
        • Lidar
      • Automated Instruments
        • Site Level Sampling Design
        • Sensor Collection Frequency
        • Instrumented Collection Types
          • Meteorology
          • Phenocams
          • Soil Sensors
          • Ground Water
          • Surface Water
      • Observational Sampling
        • Site Level Sampling Design
        • Sampling Schedules
        • Observation Types
          • Aquatic Organisms
            • Aquatic Microbes
            • Fish
            • Macroinvertebrates & Zooplankton
            • Periphyton, Phytoplankton, and Aquatic Plants
          • Terrestrial Organisms
            • Birds
            • Ground Beetles
            • Mosquitoes
            • Small Mammals
            • Soil Microbes
            • Terrestrial Plants
            • Ticks
          • Hydrology & Geomorphology
            • Discharge
            • Geomorphology
          • Biogeochemistry
          • DNA Sequences
          • Pathogens
          • Sediments
          • Soils
            • Soil Descriptions
    • Data Notifications
    • Data Guidelines and Policies
      • Acknowledging and Citing NEON
      • Publishing Research Outputs
      • Usage Policies
    • Data Management
      • Data Availability
      • Data Formats and Conventions
      • Data Processing
      • Data Quality
      • Data Product Revisions and Releases
        • Release 2021
        • Release 2022
        • Release 2023
      • NEON and Google
      • Externally Hosted Data

    Data & Samples

  • Field Sites
    • About Field Sites and Domains
    • Explore Field Sites
    • Site Management Data Product

    Field Sites

  • Impact
    • Observatory Blog
    • Case Studies
    • Spotlights
    • Papers & Publications
    • Newsroom
      • NEON in the News
      • Newsletter Archive

    Impact

  • Resources
    • Getting Started with NEON Data & Resources
    • Documents and Communication Resources
      • Papers & Publications
      • Document Library
      • Outreach Materials
    • Code Hub
      • Code Resources Guidelines
      • Code Resources Submission
      • NEON's GitHub Organization Homepage
    • Learning Hub
      • Science Videos
      • Tutorials
      • Workshops & Courses
      • Teaching Modules
      • Faculty Mentoring Networks
      • Data Education Fellows
    • Research Support and Assignable Assets
      • Field Site Coordination
      • Letters of Support
      • Mobile Deployment Platforms
      • Permits and Permissions
      • AOP Flight Campaigns
      • Excess Samples
      • Assignable Assets FAQs
    • Funding Opportunities

    Resources

  • Get Involved
    • Advisory Groups
    • Upcoming Events
    • Past Events
    • NEON Ambassador Program
    • Collaborative Works
      • EFI-NEON Ecological Forecasting Challenge
      • NCAR-NEON-Community Collaborations
      • NEON Science Summit
      • NEON Great Lakes User Group
    • Community Engagement
    • Science Seminars and Data Skills Webinars
    • Work Opportunities
      • Careers
      • Seasonal Fieldwork
      • Postdoctoral Fellows
      • Internships
        • Intern Alumni
    • Partners

    Get Involved

  • My Account
  • Search

Search

Collaborative Works

  • EFI-NEON Ecological Forecasting Challenge
  • NCAR-NEON-Community Collaborations
  • NEON Science Summit
  • NEON Great Lakes User Group

Breadcrumb

  1. Get Involved
  2. Collaborative Works
  3. NCAR-NEON-Community Collaborations

NCAR-NEON-Community Collaborations

Harvard Forest landscape

NCAR UCAR and CI Compass logos

NCAR-NEON-Community Collaborations: Predicting life in the Earth system – linking the geosciences and ecology

In 2019, the National Science Foundation (NSF) sponsored a joint National Center for Atmospheric Research (NCAR) and NEON workshop as an opportunity to bring together members of the atmospheric science and ecological communities to advance the capability of Earth system prediction to include terrestrial ecosystems and biological resources. That initial workshop has led to continued and expanding collaborations between NCAR, NEON, and the science community including:

  • A series of additional virtual and in-person workshops.
  • An NSF Data CI Pilot: NCAR and NEON Cyberinfrastructure Collaborations to Enable Convergence Research Linking the Atmospheric and Biological Sciences (more information and resources below). This work is in collaboration with the NSF CI Compass.

Data CI Pilot: NCAR and NEON Cyberinfrastructure Collaborations to Enable Convergence Research Linking the Atmospheric and Biological Sciences

This project is working to link NCAR’s Community Earth System Model (CESM) and the Community Land Model (CLM) with NEON’s measurement network to enable new synergies at the intersection of ecology and Earth science. Broadly, this project aims to create cyberinfrastructure relevant to answering questions such as:

  • What biases in NCAR models can current NEON observations address?
  • How can NCAR models inform NEON data streams?
  • What new hypotheses of atmospheric science and macroscale ecology can be tested with NEON observations and NCAR models to increase our understanding of the biosphere-atmosphere system and its response to global environmental change?
  • Can Earth system prediction be extended to ecological forecasts?

Two key cyberinfrastructure developments will enable these scientific advances:

  • The development of a containerized CESM/CLM development environment (forthcoming) including tools to gather NEON data sets, process them for model input, and for data analysis and visualization.
    • If you would like to be an early adopter and help us to test the modeling environment, please fill out this Google form.
    • Information on CLM tutorials can be found here.
  • Prototype pathways and infrastructure for the dissemination of CLM model outputs to the ecological community via NEON systems to facilitate data discovery and exploration.
    • CLM outputs for NEON sites as well as gap-filled NEON observations are available as prototype data sets on the NEON Data Portal.
    • Example outputs and model/observational comparisons can be explored below!

NCAR NEON github repository

NCAR NEON visualization repository

CLM model outputs / observational comparisons

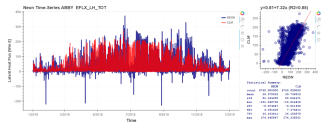
Time-series of Hourly average Latent Heat Flux at ABBY

This interactive time-series plot shows the hourly average Latent Heat Flux [W/m2] at the Abby Road site from the NEON program and CLM simulation. The top right scatter plot shows the correlation between the observed and simulated Latent Heat Flux [W/m2] at the same NEON site (ABBY). The bottom right features the statistical summary of observed and simulated Latent Heat Flux.

In this plot, you can zoom in or select a time period to better investigate how the hourly average latent heat flux varies.

explore graph
Image
NCAR graph ABBY EFLX hourly

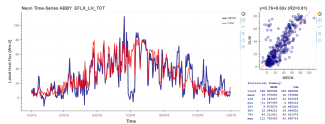
Time-series of Daily average Latent Heat Flux at ABBY

This interactive figure compares the daily average Latent Heat Flux [W/m2] at NEON's Abby Road site with CLM simulation. The left plot shows the time-series of the daily average Latent Heat Flux from NEON and model. Select a period of interest to zoom and investigate further.

The top right plot shows the correlation between observed and simulated Latent Heat Flux at ABBY. Finally, the statistical summary of observed and simulated Latent Heat Flux are featured in the bottom right panel.

explore graph
Image
NCAR graph ABBY EFLX daily

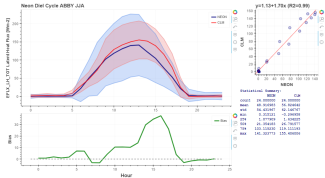
Diurnal Cycle of Latent Heat Flux at ABBY

This figure shows the daily cycle (also known as diurnal cycle) of observed (NEON) and simulated (CLM) Latent Heat Flux during summer 2018 at NEON's Abby Road site (ABBY).

The top left corner shows how the Latent Heat Flux average of each hour from all summer 2018 days change during the day for both NEON and CLM.

explore graph
Image
NCAR graph ABBY EFLX JJA


NEON Logo

Follow Us:

Join Our Newsletter

Get updates on events, opportunities, and how NEON is being used today.

Subscribe Now

Footer

  • My Account
  • About Us
  • Newsroom
  • Contact Us
  • Terms & Conditions
  • Careers

Copyright © Battelle, 2019-2020

The National Ecological Observatory Network is a major facility fully funded by the National Science Foundation.

Any opinions, findings and conclusions or recommendations expressed in this material do not necessarily reflect the views of the National Science Foundation.