Sensor Collection Frequency
Automated sensors in the field allow for continuous sampling at regular and high frequencies that are typically not feasible using field personnel. Below are some high-level comparisons of data collection frequency by different sensors at aquatic and terrestrial field sites.
Aquatic Sensor Collection Frequency
In streams, rivers, and lakes, constituent concentrations may vary over short time scales, often due to biological activities and meteorological events, which can be logistically challenging for collecting grab samples. Storm events, which are difficult to safely sample, can be responsible for large portions of the total annual flux of nutrients and organic carbon in streams. Thus, adequately capturing aquatic system variability requires the collection of high temporal resolution data using in situ sensors, where possible. The AIS sampling frequency is designed to measure concentrations that can be used to estimate fluxes of organic matter, nutrients, and suspended solids under conditions that are likely quantitatively important yet challenging to sample with traditional “grab” sampling approaches. Additionally, this continuous data can help us better understand how aquatic ecosystems respond to environmental changes and drive ecosystem dynamics, such as changes in community composition.
Terrestrial Sensor Collection Frequency
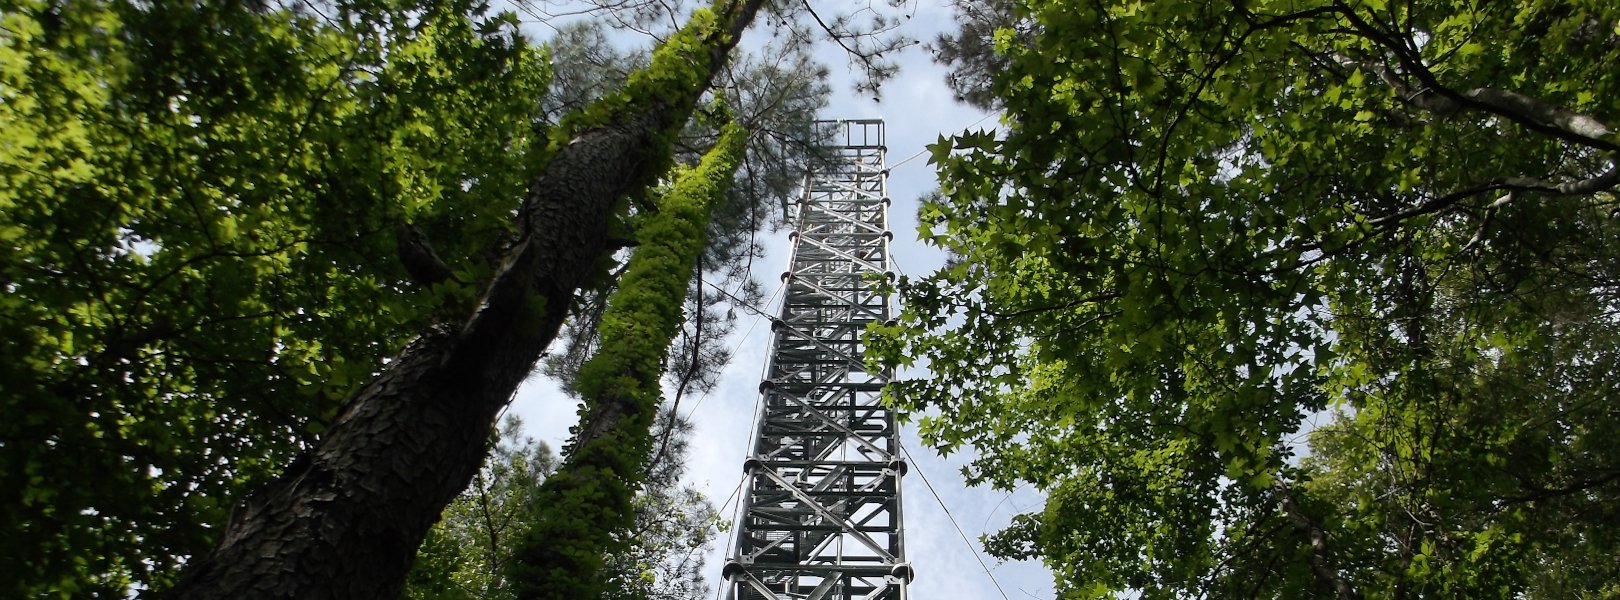
NEON deploys automated instruments to collect micrometeorological, soil, and phenological data at NEON field sites. Data are collected continuously to capture patterns and cycles across various time periods, ranging from seconds to years. NEON calibrates and quality checks sensors to minimize measurement errors and maximize the quality of collected data. The data collected by automated instrument systems (IS) are standardized but the systems vary slightly by field site type. Collection frequencies vary by sensor and are summarized below for aquatic and terrestrial sites.
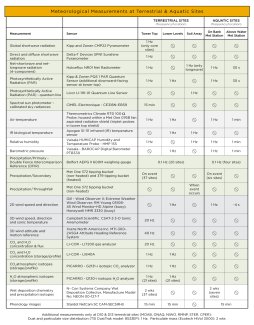
Measurements made at meteorological stations
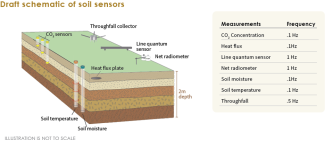
Schematic layout of a sensor-based soil plot. Note that some sensors are only present in a subset of soil plots.