neonUtilities for R and Python
neonUtilities is a code package for accessing and working with NEON data, available in R and Python (as neonutilities).
Data Access
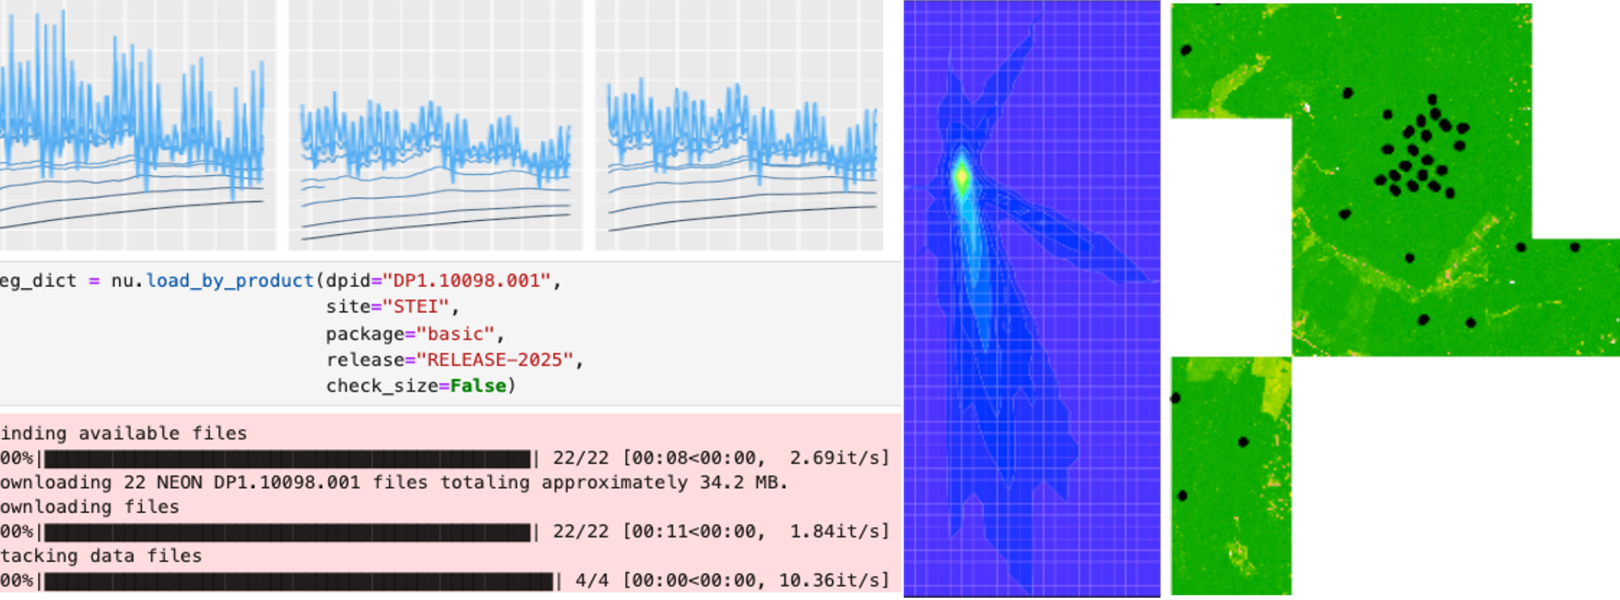
neonUtilities provides functions for downloading data via the NEON API. These functions primarily use the data endpoint of the API, and allow the user to download by data product, site, and time period. In some cases it enables more specialized downloads, such as downloading by averaging interval for sensor data and by tile for tiled remote sensing data.
Data Transformation
In addition to download, neonUtilities provides stacking functions for tabular data products. NEON data are published in self-contained packages for each site and month, and neonUtilities enables smooth stacking to create data tables that span sites and months.
- Sensor data: Sensor data files are published with location information (horizontal and vertical position) in the file name; the stacking process in neonUtilities adds this information to the data table.
- Surface-atmosphere exchange data: Surface-atmosphere exchange (eddy covariance) data files are published in HDF5 format. neonUtilties provides options for extracting customized subsets of data from the H5 files and stacking to tabular data tables.
- Observational data: Many observational data products include tables of data that are relevant to all time periods of data collected, such as the mapped locations of monitored trees, or the quality control data from a laboratory, and these data are published in each monthly package of data. neonUtilities extracts the most up-to-date copy of these data for stacking.
Package Documentation
There is a ReadTheDocs page for the Python version of neonutilities, and a standard R manual for the R version. If you are new to the package, we recommend starting with tutorials rather than package documents, see FAQ below.
Frequently Asked Questions
How do I learn to use the neonUtilities package?
We recommend starting with the Download and Explore tutorial. This tutorial provides an introduction to both NEON data and the neonUtilities package. If you prefer to learn via video, the Download and Explore content is available as a recorded webinar as well (note the webinar includes only instruction in R, while the tutorial includes instructions in both R and Python).
Does neonUtilities have customized code to help me work with a specific data product?
In general the functions in neonUtilities are fairly generic, and work at the level of a type of NEON data, such as observational or instrumented. For guidance on working with specific data products, start with the Get Started with NEON Data tutorial series and the Quick Start Guide for each data product. For code resources for specific data products, check out the Code Hub.
What if I prefer to write my own code to use the NEON API?
You are welcome to write your own code! If you are working with remote sensing data, neonUtilities is primarily a wrapper for the API, and does not do any data transformation after download. If you are working with tabular data, keep in mind that the data transformation step in neonUtilities is substantial. See "Data transformation" above.
What are all the input options for neonUtilities functions?
Use the neonUtilities cheat sheet for a quick guide to function inputs and their meanings. You can also use the package help files for each function.