Terrestrial Instrument System (TIS)
The NEON Terrestrial Instrument System (TIS) collects meteorological, soil, and phenology data at terrestrial field sites. TIS measurements are colocated and coordinated with NEON’s terrestrial observation system and airborne observation platform.
Sampling Design
At each field site, NEON collects automated instrument measurements, remote sensing data, field observations and samples in close proximity to each other and at different temporal scales. Locations of instruments and observational sampling plots are strategically placed to maximize data capture to measure the representative ecosystem of each field site. These activities allow for the quantification of ecological parameters and the detection of multi-faceted ecosystem responses to drivers of change.
Sensors & Infrastructure
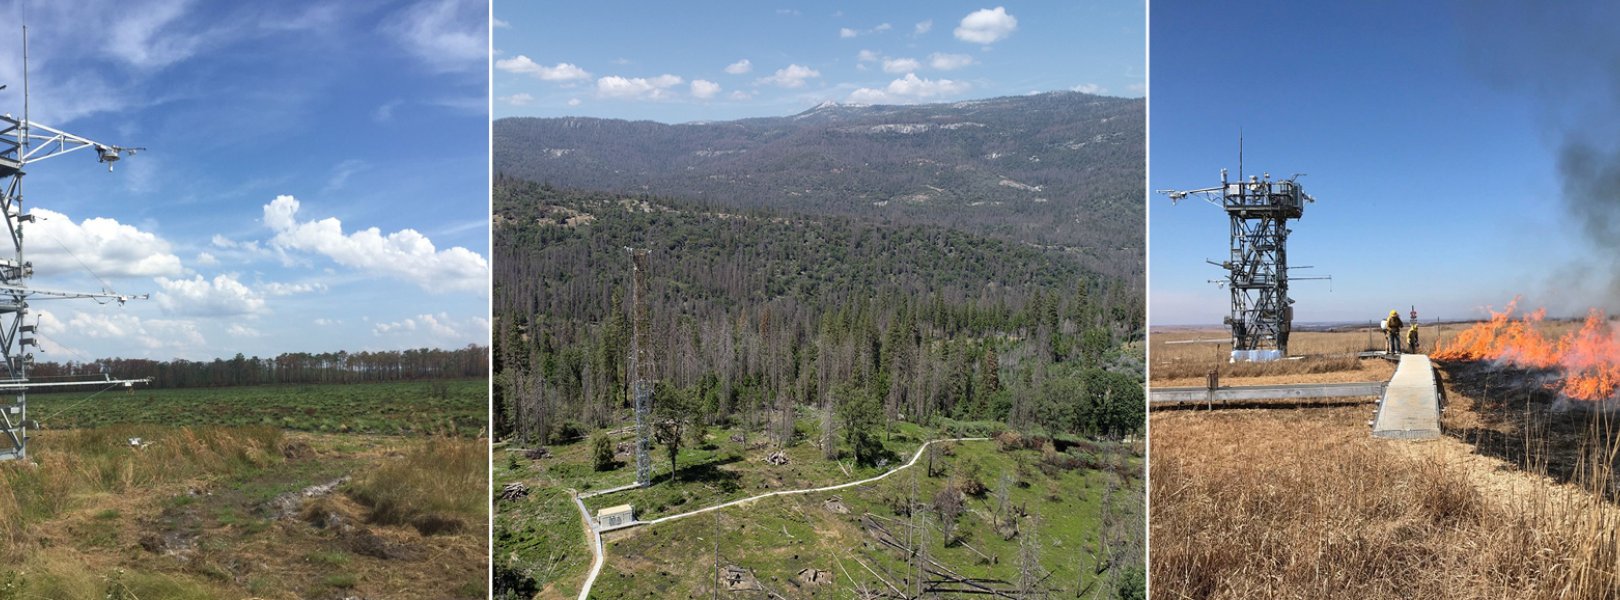
Micrometeorological towers
Micrometeorological towers collect weather and climate data, including fluxes of carbon, water, and energy between terrestrial ecosystems and the atmosphere using a series of automated sensors. Towers are positioned to maximize data capture along the predominant wind direction and to measure the representative ecosystem at the site. Tower height is determined based on ecosystem characteristics, with the goal of capturing a full vertical profile of atmospheric conditions from the top of the vegetation canopy to the ground. Profile measurement levels are distributed based on the canopy structure of the site.
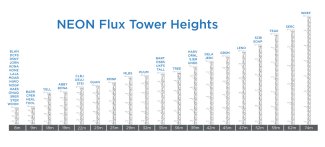
Flux tower heights across NEON field sites
Soil sensor arrays
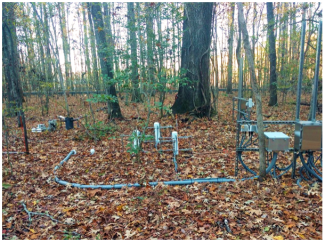
Layout of a sensor-based soil plot at the LENO field site (not all sensors are installed in every plot).
Each terrestrial site includes five sensor-based soil plots near the tower where a variety of soil and aboveground measurements are made. The exact layout varies from site to site, but the soil plots are typically arranged in a transect, spaced about 40 m apart, and placed in the locally dominant soil type immediately surrounding the tower. A variety of measurements are made including profiles of soil temperature and moisture below the surface and throughfall, relative humidity, and photosynthetically active radiation aboveground. A soil pit (the “Megapit”) was dug nearby to characterize the soil where the sensors are installed, inform sensor depth placement, and collect soil for archiving in the Megapit Soil Archive.
Precipitation gauges
Precipitation is measured near ground level using a Double Fence Intercomparison Reference (DFIR) at many sites and measured using a tipping bucket at the tower top at the remaining sites. Throughfall sensors are also placed in the soil array at most terrestrial sites (typically excluding grasslands or sites with very low canopies).
This spreadsheet provides the quantity and type of precipitation collector(s) located at each NEON site.
Phenocams
A phenocam is mounted at the top of each meteorological tower to capture above canopy phenology. A second camera is located near the bottom of the tower to capture below canopy phenology.
Data Collection Frequency
NEON deploys automated instruments to collect micrometeorological, soil, and phenological data at NEON field sites. Data are collected continuously to capture patterns and cycles across various time periods, ranging from seconds to years. NEON calibrates and quality checks sensors to minimize measurement errors and maximize the quality of collected data. The data collected by automated instrument systems (IS) are standardized but the systems vary slightly by field site type. Collection frequencies vary by sensor and are summarized below for aquatic and terrestrial sites.
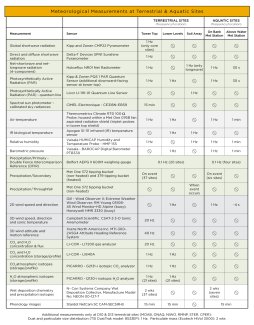
Measurements made at meteorological stations
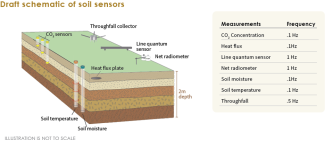
Schematic layout of a sensor-based soil plot. Note that some sensors are only present in a subset of soil plots.