Flight Schedules and Coverage
The goal of NEON's airborne remote sensing program is to acquire airborne lidar and hyperspectral data capable of producing consistent, quantitative measurements spanning multiple years.
At each terrestrial site a minimum of 100 km2 is surveyed over an area encompassing the NEON flux tower airsheds and distributed long-term observational sampling plots, representative vegetation types, and watershed boundaries for both terrestrial and aquatic sites. The NEON flight season typically runs from March to October each year. Remote sensing data are collected over aquatic and terrestrial field sites during peak greenness. Collection of AOP data is also synchronized with data collected on the ground at each site. This allows scientists to develop a more comprehensive picture of how different observations scale and how measurements taken from airborne remote sensing instruments correlate with observations made on the ground.
The AOP remote sensing system takes advantage of the strong synergy between imaging spectroscopy and lidar to measure plant canopy biogeochemistry and habitat structure characteristics around NEON sites. Invasive plants can be detected both through their spectral properties and their structural properties. Pest and pathogen outbreaks, changes in competitive relations, responses to disturbances like wildfire, and many features of land use are readily observed and quantified using the powerful combination of biochemical and structural information provided by spectroscopy and waveform lidar (Kampe et al. 2010).
Up-scaling of both in situ measurements and airborne observations to continental scales requires a flight sampling design that: 1) covers the "area-of-influence" associated with cumulative eddy covariance flux tower observations and field measurements; 2) captures landscape environmental representativeness and heterogeneity (e.g., ecological and topographic gradients); 3) is sensitive to temporal system variation (e.g., phenology); and 4) is large enough to capture the impacts of unanticipated disturbance events.
AOP Flight Box Design
Airborne survey boundaries (flight boxes) at each NEON site are designed to produce consistent datasets at nominal 1 m resolution from the NEON imaging spectrometer and lidar. Areas within flight boxes are acquired at NEON's terrestrial and aquatic sites in every two to five years during annual periods of 90% maximum foliage (peak greenness). The criteria used to design flight boxes over each site result in datasets with adequate spatial extent to support scaling of in situ data from the NEON Terrestrial Instrumented System (TIS), Terrestrial Observation System (TOS), Aquatic Instrumented System (AIS), and Aquatics Observation System (AOS) to regional scales. The criteria produce systematic "minimum size" datasets across sites and ecological gradients, enabling robust statistical analysis for continental-scale modeling. The criteria also promote data acquisition efficiency by assigning flight boxes within an airborne survey area to either a high (Priority 1) or low (Priority 2) acquisition priority, providing airborne sensor operators with greater flexibility in the event that poor weather conditions prevent 100% data acquisition during an annual survey at a site.
A minimum flight box of 10 km x 10 km is flown over each terrestrial site. The flight box is initially centered over the NEON tower but repositioned as necessary to capture the tower airshed and TOS sampling boundary in their entirety. Because a small percentage of airflow from outside of the tower airshed will interact with the tower sensors, it is important to enable characterization of the vegetation/land cover for these non-airshed areas with AOP observations; thus, a minimum of 2 km distance is maintained between the tower and the edge of the airborne survey area. The placement of the minimum 10 km x 10 km airborne survey area is further repositioned or expanded to include the upstream watersheds of the TOS boundary and aquatic site, and to capture ecologically relevant areas immediately adjacent to the TOS boundary that are important to acquire because of their potential impacts on the TOS sampling area. Additionally, predominant land cover patterns, climate patterns, or ecological gradients that are relevant to domain-specific science themes and continental scale modeling will be considered for inclusion in the flight box.
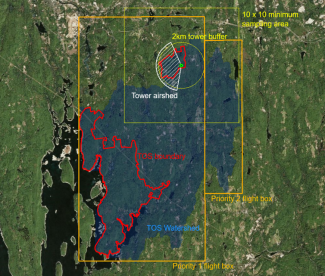
Priority 1 and priority 2 flight boxes for Harvard Forest (HARV)
Viewing and Accessing Flight Boxes
Flight boxes can be viewed in the field site map on the Explore Field Sites webpage. To download the flight boxes, visit the Spatial Data Layers & Maps webpage, where polygon flight boxes can be downloaded as a shapefile or KMZ file. These files include flight boundaries for aquatic and terrestrial field sites at all sites in NEON Domains D01 to D19. Please note that flight boundaries may change from year to year. Contact us for the most current plans and to coordinate research activities on the ground.
How Flights Are Scheduled
The interannual flight schedule is primarily constrained by the phenology of vegetation at each site and typical patterns of cloud cover during different months of the year. NEON performs surveys when the dominant plant species at a site are at or near peak foliar growth ("greenness") so that estimates of leaf area, foliar biomass, gas exchange, etc. are accurate and comparable over time. NEON also attempts to perform surveys when atmospheric conditions are cloud-free. Atmospheric conditions greatly influence the quality of data produced by the spectrometer. Accurately characterizing clouds and aerosols within the atmosphere during flight—and then representing these within radiative transfer models used for the retrieval of surface spectral reflectance—is a major challenge. Clouds often interfere with the acquisition of land surface data, and even when they are not optically thick enough to significantly diminish the signal, they may introduce errors in data that are difficult to remove through modeling alone.
Surveying During Peak Greenness
In an effort to minimize variability in spectral reflectance retrievals among data sets collected over multiple years and control for variation in the phenological cycle, AOP flight campaigns are scheduled to take place during peak vegetation greenness, at solar elevation angles greater than 40 degrees and when cloud cover represents less than 10% of sky coverage. For each NEON site, time series of 8-day composite enhanced vegetation indices (EVI) from the MODIS sensor onboard NASA's Terra and Aqua satellites are processed for major vegetation types within each site's terrestrial observation (TOS) sampling boundary and AOP Priority 1 flight box. Peak greenness periods for each vegetation class are determined by identifying end-of-spring (>90%) and start-of-fall (>90% or 80%, depending on vegetation type) phenophase transition dates in the EVI time series (Figure 1).
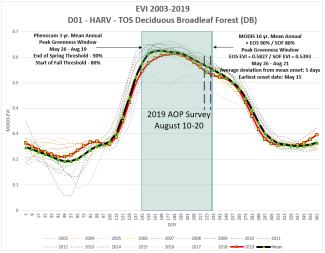
Mean and annual peak greenness periods for deciduous broadleaf vegetation at Harvard Forest (HARV), with 2019 AOP survey dates.
Tower-based phenocam images (Figure 2) are then used to generate phenophase transition dates for validation of satellite-based EVI peak greenness measurements in areas characterized by similar vegetation.
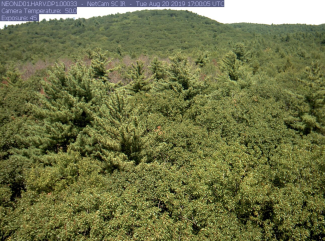
Phenocam image showing the condition of foliage during the last AOP survey date at HARV in 2019.
Inter-annual variability in the timing of end-of-spring and start-of-fall peak-greenness is biome-specific. Deciduous broadleaf forests, evergreen needle forests, and tundra are relatively consistent year-to-year because green-up and senescence are linked to broad-scale seasonal changes in temperature and precipitation; grasslands and savannas are highly variable, with green-up mainly driven by individual rainfall events. Agricultural sites are also variable due to cropping practices that tend to track short-term climate trends. Within a given flight box there may be multiple, asynchronous peak greenness periods for different vegetation types, which can make flight scheduling a challenge. Therefore, the dates corresponding to the mean peak greenness period for dominant vegetation are used to determine the acceptable survey dates at a given site, and adjustments are then made based on the phenology of secondary vegetation types.
Cloud-free Data Collection
To calculate the number of days required to collect cloud-free data at each site within its peak greenness period, cloud cover percentages are derived for each flight box from a time series of daily MODIS data, from which the mean number of cloud-free days per month are calculated (Figure 3). Monte Carlo simulation is then used to determine the probabilities that flights of specific durations will result in cloud-free data acquisitions during the months of the year coinciding with each site's peak greenness period. For sites where field-based canopy foliar sampling is planned, cloud-free collection probabilities are set to 90% confidence, while sites without foliar sampling are set to 60% confidence. This results in flight deployment windows for all sites scheduled to be flown in a given year, which are assembled into an optimized flight campaign schedule that maximizes the likelihood of cloud-free data collection during peak greenness, while minimizing transit time between Domains.
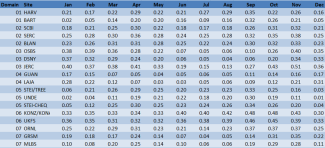
Figure 3 - Percent of days each month with <10% cloud cover over NEON AOP priority 1 flight boxes.
Current and Past Schedules
NEON Leadership is continually assessing conditions across the Observatory and may reinstate closures if local conditions dictate. For this reason, the AOP flight schedule is tentative and subject to change without notice. Please review the Observatory Status Page or contact NEON for the latest information on the 2026 schedule.
While preliminary data collection started in 2013, the standard schedule for full operations of the AOP began in 2018. Under the current plan, data are collected annually at field sites in the continental U.S. and Alaska at a minimum of three out of every five years, and in Puerto Rico and Hawaii every five years. The data are processed after each survey and made available - including dates of acquisition - via the NEON data portal.
Current Schedule
2026 Flight Schedule - Payloads 2&3
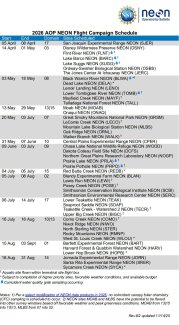
2026 schedule for Airborne Observation Platform flights.
If you are interested in tracking the 2026 season, sign up to receive daily flight report emails by NEON Domain or visit our flight report archive. Please note, you will only receive emails during the time period the AOP is in the Domain you have signed up to follow.
Past Schedules
The downloadable CSV file below contains the flight dates for all of the previous AOP site visits. The table also shows the flight dates and other relevant details, including publication and sensor information (all Camera Sensors are PhaseOne).
Download AOP Flight Dates 2013-2025 CSV
| Year | Site | Visit | Payload | Pub Date | Flight Dates | NIS # | Lidar | Camera | Sensor Outages |
|---|---|---|---|---|---|---|---|---|---|
| 2013 | CPER | 1 | P1C1 | 2013-06 | 2013-06-25 | NIS1 | Teledyne Optech Gemini 11SEN287 | D8900 EH021537 |
|
| 2013 | SJER | 1 | P1C1 | 2013-06 | 2013-06-11, 2013-06-13 | NIS1 | Teledyne Optech Gemini 11SEN287 | D8900 EH021537 |
|
| 2013 | SOAP | 1 | P1C1 | 2013-06 | 2013-06-12 | NIS1 | Teledyne Optech Gemini 11SEN287 | D8900 EH021537 |
WaveformLidar |
| 2013 | STER | 1 | P1C1 | 2013-06 | 2013-06-24 | NIS1 | Teledyne Optech Gemini 11SEN287 | D8900 EH021537 |
NIS,WaveformLidar |
| 2013 | TEAK | 1 | P1C1 | 2013-06 | 2013-06-14, 2013-06-15 | NIS1 | Teledyne Optech Gemini 11SEN287 | D8900 EH021537 |
Relevant Publications
Spanning scales: The airborne spatial and temporal sampling design of the National Ecological Observatory Network. Musinsky, J., Goulden, T., Wirth, G., Leisso, N., Krause, K., Haynes, M., & Chapman, C. (2022). Methods in Ecology and Evolution, 13(9), 1866–1884. https://doi.org/10.1111/2041-210X.13942
Search publications using NEON AOP data in our curated Zotero library, or by using keywords (e.g., lidar, AOP) in our NEON Dimensions page.