Ticks
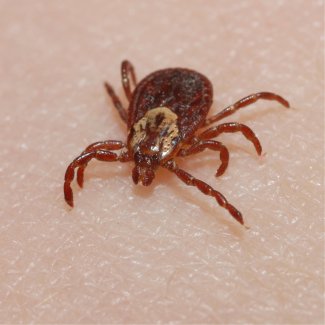
Tick
The spread of tick-borne pathogens is of particular interest to the Centers for Disease Control and Prevention (CDC) and other public health agencies due to their impact on human health.
Tick-borne diseases, including Lyme disease, have been growing in prevalence and spreading into new areas over the last few decades. More than 300,000 cases of Lyme disease—a serious disease that can lead to long-term neurologic, cardiac and rheumatologic effects when left untreated—were reported in 2018. Diseases such as Rocky Mountain Spotted Fever and Anaplasmosis, which can both cause severe illness or death in vulnerable populations, have also been growing steadily in recent years. Understanding the factors that influence the spread and abundance of ticks, and the diseases they carry, is an urgent public health concern. Further, monitoring how tick populations respond to climate shifts over time will provide insights into how the ecosystems they live in are changing, including how pathogen transmission cycles shift.
NEON samples tick populations at terrestrial field sites across the United States to characterize patterns of tick abundance, diversity, and pathogen status. Monitoring how tick populations change over time and across terrestrial field sites provides valuable insights into where and why tick-borne pathogen transmission patterns shift across the United States.
NEON selected ticks for data collection because of their ecological and epidemiological significance. Ticks:
- have a wide geographical distribution allowing for standardized continental-scale monitoring.
- are sensitive to shifts in climate, land use and invasive species.
- represent a key food source for terrestrial predators.
- serve as vectors for parasites and pathogens to humans, livestock and wildlife.
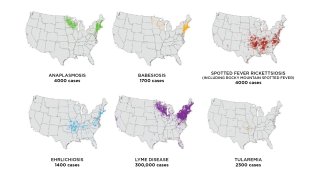
Tickborne diseases by geographic area of the U.S. in 2018
Sampling Design and Methods
At each terrestrial field site, six 40m x 40m tick sampling plots are established. These plots are colocated with distributed base plots in which scientists collect a variety of additional plant, soil, beetle, microbe and biogeochemistry data.
Tick sampling bouts are conducted at regular intervals throughout the growing season which is defined at each site based on the average greening period for local vegetation. Sampling only occurs if the high temperature on two consecutive days prior to planned sampling exceeds 0 °C. During the growing season at each site, ticks are sampled:
- Every three weeks at sites where five or more ticks have been detected within a calendar year.
- Every six weeks at sites where ticks have not been observed or are present in extremely low numbers (five or fewer ticks detected within a calendar year)
Collection
Tick specimens are collected at all terrestrial sites across all NEON domains with the exception of the Pacific Tropical (Hawaii). To collect ticks, field scientists use drag cloths. Drag sampling is an established method of tick sampling that has been used by researchers and public health agencies to monitor tick populations since the early 20th century. It is an easy, effective, and low-cost method of collecting ticks from terrestrial environments.
- A 1 m2 white cloth is dragged along the ground at a slow pace around the 160 m perimeter of a 40 m x 40 m sampling plot. If vegetation is dense, they use the drag cloth to flag an equivalent transect line around the perimeter of the plot
- Ticks that cling to the cloth are collected, counted and categorized by species, sex and life stage (adult, nymph or larvae).
- A subset of the collected ticks is sent to an external facility where they are tested for tick-borne pathogens, and then a smaller selection of specimens are archived.
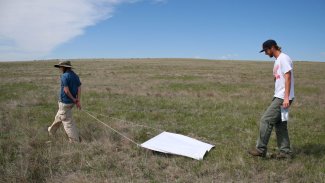
A tick drag being conducted at the Central Plains Experimental Research (CPER) field site.
Processing and Lab Analysis
Once samples are collected from the field, NEON field ecologists process, pack up and ship the samples to an external lab where ticks are identified to species, life stage and sex (when possible).
A subset of identified ticks are sent to the Laboratory of Medical Zoology (LMZ) at the University of Massachusetts Amherst, a national tick testing lab, to conduct DNA analysis to identify which pathogens each specimen is carrying. Some ticks are set aside for long-term archiving.
Pathogen testing is conducted on a subset of identified nymphal ticks. Nymphs are tested for the presence or absence of viral or protozoan pathogens known to be carried by their genera. Tested pathogens include:
- Lyme Disease (Borrelia burgdorferi)
- Spotted Fever Rickettsiosis, including Rocky Mountain Spotted Fever (Rickettsia bacteria)
- Anaplasmosis (Anaplasma phagocytophilum)
- Babesiosis (Babesia microti)
- Tularemia (Francisella tularensis)
| Tick Genera | Pathogens Tested |
|---|---|
| Ixodes spp. (e.g., deer tick/ western blacklegged tick) | Anaplasma phagocytophilum, Babesia microti, Ehrlichia muris-like agent, Borrelia burgdorferi, Borrelia miyamotoi, and Borrelia mayonii. |
| Dermacentor spp. (dog tick/wood tick) and Amblyomma spp. (Lone Star tick) | Anaplasma phagocytophilum, Francisella tularensis, Rickettsia rickettsii, Ehrlichia chaffeensis, Borrelia lonestari, and Ehrlichia ewingii. |
Data Products
Tick abundance and density data include:
- Ticks sampled using drag cloths (DP1.10093.001)
A subset of the ticks used to derive the abundance and density data products are sent to external labs for pathogen testing. Tick pathogen presence/absence data include:
- Tick-borne pathogen status (DP1.10092.001)
Archival Samples
Tick specimens are archived at the NEON Biorepository (located in Tempe, Arizona at the Arizona State University Biocollections) and the US National Tick Collection (located in Statesboro, GA at Georgia Southern University). Ticks are collected at terrestrial sites by NEON staff and identified by contracted taxonomists. Select ticks are tested for pathogens; after pathogen analysis, any remaining genomic extract from individual ticks are archived. Any ticks that are not assayed for pathogens are archived in groups of individuals of the same species and sex collected during the same collection bout.
| Types of Samples | Collection Years | Storage Condition | Storage Container | Quantity Archived (Annually) † | Archive Location |
|---|---|---|---|---|---|
| Genomic extracts, from pathogen testing | 2014-ongoing | -80 °C | 2 mL cryovials | 3,000 to 4,000 extracts | NEON Biorepository |
| Identified ticks, bulk | 2014-2023 | 95% ethanol | 2-15 mL vials | 750 to 1,200 | US National Tick Collection |
| Identified ticks, bulk | 2024-ongoing | 95% ethanol | 2-15 mL vials | 750 to 1,200 | NEON Biorepository |
† Quantities represented in this table are annual quantities expected from sampling conducted throughout the observatory during full Operations. Actual quantities (particularly from years in early construction) may differ from these projections.