NSF NEON | Open Data to Understand our Ecosystems logo
Sign In

Main navigation

  • About Us
    • Overview
      • Spatial and Temporal Design
      • History
    • Vision and Management
    • Advisory Groups
      • Advisory Committee: STEAC
      • Technical Working Groups (TWGs)
    • FAQ
    • Contact Us
      • Field Offices
    • User Accounts
    • Staff

    About Us

  • Data & Samples
    • Data Portal
      • Explore Data Products
      • Data Availability Charts
      • Spatial Data & Maps
      • Document Library
      • API & GraphQL
      • Prototype Data
      • External Lab Data Ingest (restricted)
    • Samples & Specimens
      • Discover and Use NEON Samples
        • Sample Types
        • Sample Repositories
        • Sample Explorer
        • Megapit and Distributed Initial Characterization Soil Archives
        • Excess Samples
      • Sample Processing
      • Sample Quality
      • Taxonomic Lists
    • Collection Methods
      • Protocols & Standardized Methods
      • AIrborne Remote Sensing
        • Flight Box Design
        • Flight Schedules and Coverage
        • Daily Flight Reports
        • Camera
        • Imaging Spectrometer
        • Lidar
      • Automated Instruments
        • Site Level Sampling Design
        • Sensor Collection Frequency
        • Instrumented Collection Types
          • Meteorology
          • Phenocams
          • Soil Sensors
          • Ground Water
          • Surface Water
      • Observational Sampling
        • Site Level Sampling Design
        • Sampling Schedules
        • Observation Types
          • Aquatic Organisms
            • Aquatic Microbes
            • Fish
            • Macroinvertebrates & Zooplankton
            • Periphyton, Phytoplankton, and Aquatic Plants
          • Terrestrial Organisms
            • Birds
            • Ground Beetles
            • Mosquitoes
            • Small Mammals
            • Soil Microbes
            • Terrestrial Plants
            • Ticks
          • Hydrology & Geomorphology
            • Discharge
            • Geomorphology
          • Biogeochemistry
          • DNA Sequences
          • Pathogens
          • Sediments
          • Soils
            • Soil Descriptions
    • Data Notifications
    • Data Guidelines and Policies
      • Acknowledging and Citing NEON
      • Publishing Research Outputs
      • Usage Policies
    • Data Management
      • Data Availability
      • Data Formats and Conventions
      • Data Processing
      • Data Quality
      • Data Product Revisions and Releases
        • Release 2021
        • Release 2022
      • Externally Hosted Data

    Data & Samples

  • Field Sites
    • About Field Sites and Domains
    • Explore Field Sites
    • Site Management Data Product

    Field Sites

  • Impact
    • Observatory Blog
    • Case Studies
    • Spotlights
    • Papers & Publications
    • Newsroom
      • NEON in the News
      • Newsletter Archive

    Impact

  • Resources
    • Getting Started with NEON Data & Resources
    • Documents and Communication Resources
      • Papers & Publications
      • Document Library
      • Outreach Materials
    • Code Hub
      • Code Resources Guidelines
      • Code Resources Submission
      • NEON's GitHub Organization Homepage
    • Learning Hub
      • Science Videos
      • Tutorials
      • Workshops & Courses
      • Teaching Modules
      • Faculty Mentoring Networks
      • Data Education Fellows
    • Research Support and Assignable Assets
      • Field Site Coordination
      • Letters of Support
      • Mobile Deployment Platforms
      • Permits and Permissions
      • AOP Flight Campaigns
      • Excess Samples
      • Assignable Assets FAQs
    • Funding Opportunities

    Resources

  • Get Involved
    • Advisory Groups
    • Upcoming Events
    • Past Events
    • NEON Ambassador Program
    • Collaborative Works
      • EFI-NEON Ecological Forecasting Challenge
      • NCAR-NEON-Community Collaborations
      • NEON Science Summit
    • Community Engagement
    • Work Opportunities
      • Careers
      • Seasonal Fieldwork
      • Postdoctoral Fellows
      • Internships
        • Intern Alumni
    • Partners

    Get Involved

  • My Account
  • Search

Search

Learning Hub

  • Science Videos
  • Tutorials
  • Workshops & Courses
  • Teaching Modules
  • Faculty Mentoring Networks
  • Data Education Fellows

Breadcrumb

  1. Resources
  2. Learning Hub
  3. Tutorials
  4. Interactive Data Vizualization with R and Plotly

Tutorial

Interactive Data Vizualization with R and Plotly

Authors: Megan A. Jones, Leah A. Wasser

Last Updated: Apr 8, 2021

Plotly - Interactive (and Online) Plots

Plotly bills itself as "a collaborative platform for modern data science". You can use it to build interactive plots that can easily be shared with others (like the Quantifying The Drivers and Impacts of Natural Disturbance Events – The 2013 Colorado Floods lessons).

You will need an free online Plotly account to post & share you plots online. But you can create the plots and use them on your local computer without an account. If you do not wish to share plots online you can skip to Step 3: Create Plotly plot.

Additional information on the plotly R package can be found on the Plotly R Getting Started page.

Note: Plotly doesn't just work with R -- other programs include Python, MATLAB, Excel, and JavaScript.

Step 1: Create account

If you do not already have an account, you need to set up an account by visiting the Plotly website and following the directions there.

Step 2: Connect account to R

To share plots from R (or RStudio) to Plotly, you have to connect to your account. This is done through an API (Application Program Interface). You can find your username & API key in your profile settings on the Plotly website under the "API key" menu option.

To link your account to your R, use the following commands, substituting in your own username & key as appropriate.

# set plotly user name
Sys.setenv("plotly_username"="YOUR_USERNAME")
# set plotly API key
Sys.setenv("plotly_api_key"="YOUR_KEY")

Step 3: Create Plotly plot

There are lots of ways to plot with the plotly package. We briefly describe two basic functions plotly() and ggplotly(). For more information on plotting in R with Plotly, check out the Plotly R library page.

Here we use the example dataframe economics that comes with the package.

# load packages
library(ggplot2) # to create plots and feed to ggplotly()
library(plotly)  # to create interactive plots

# view str of example dataset
str(economics)

## tibble [574 × 6] (S3: spec_tbl_df/tbl_df/tbl/data.frame)
##  $ date    : Date[1:574], format: "1967-07-01" "1967-08-01" ...
##  $ pce     : num [1:574] 507 510 516 512 517 ...
##  $ pop     : num [1:574] 198712 198911 199113 199311 199498 ...
##  $ psavert : num [1:574] 12.6 12.6 11.9 12.9 12.8 11.8 11.7 12.3 11.7 12.3 ...
##  $ uempmed : num [1:574] 4.5 4.7 4.6 4.9 4.7 4.8 5.1 4.5 4.1 4.6 ...
##  $ unemploy: num [1:574] 2944 2945 2958 3143 3066 ...

# plot with the plot_ly function
unempPerCapita <- plot_ly(x =economics$date, y = economics$unemploy/economics$pop)

To make your plotly plot in R, run the following line:

unempPerCapita 

Note: This plot is interactive within the R environment but is not as posted on this website.

If you already use ggplot to create your plots, you can directly turn your ggplot objects into interactive plots with ggplotly().

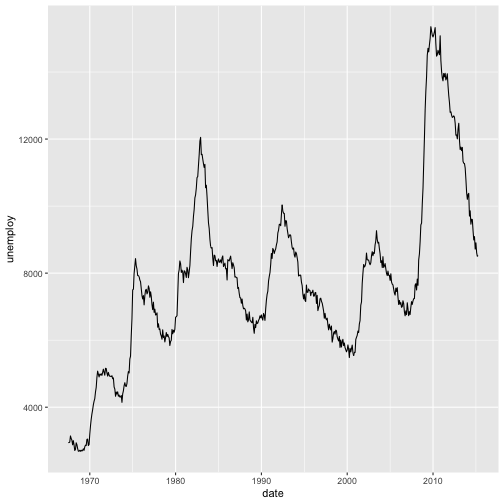
## plot with ggplot, then ggplotly

unemployment <- ggplot(economics, aes(date,unemploy)) + geom_line()
unemployment

To make your plotly plot in R, run the following line:

ggplotly(unemployment)

Note: This plot is interactive within the R environment but is not as posted on this website.

Step 4: Publish to Plotly

The function plotly_POST() allows you to post any plotly plot to your account.

# publish plotly plot to your plotly online account
api_create(unemployment)

Examples

The plots below were generated using R code that harnesses the power of the ggplot2 and the plotly packages. The plotly code utilizes the RopenSci plotly packages - check them out!

<iframe width="640" height="360" frameborder="0" seamless="seamless" scrolling="no" src="https://plot.ly/~leahawasser/24.embed?width=460&height=293"></iframe> <iframe width="640" height="360" frameborder="0" seamless="seamless" scrolling="no" src="https://plot.ly/~leahawasser/6.embed?width=460&height=345"></iframe> <iframe width="640" height="360" frameborder="0" seamless="seamless" scrolling="no" src="https://plot.ly/~leahawasser/16.embed?width=800&height=600"></iframe> <iframe width="640" height="360" frameborder="0" seamless="seamless" scrolling="no" src="https://plot.ly/~leahawasser/19.embed?width=800&height=600"></iframe>
**Data Tip** Are you a Python user? Use `matplotlib` to create and publish visualizations.

Get Lesson Code

DataVis-plotly-R.R

Questions?

If you have questions or comments on this content, please contact us.

Contact Us
NEON Logo

Follow Us:

Join Our Newsletter

Get updates on events, opportunities, and how NEON is being used today.

Subscribe Now

Footer

  • My Account
  • About Us
  • Newsroom
  • Contact Us
  • Terms & Conditions
  • Careers

Copyright © Battelle, 2019-2020

The National Ecological Observatory Network is a major facility fully funded by the National Science Foundation.

Any opinions, findings and conclusions or recommendations expressed in this material do not necessarily reflect the views of the National Science Foundation.