Research Highlight
NEON Data Provides Insights for Invasion Ecology
May 4, 2022
Look around your ecosystem—there are invaders everywhere! From cheatgrass in the western prairies to zebra mussels in the Great Lakes, biological invasions are changing ecosystems across North America.
Understanding how invasions start, the factors that allow invasive species to thrive, and their impact on native ecosystems are critical questions for ecology. A paper published in Ecosphere highlights the ways in which data from the NEON program could help ecologists explore the impacts and mechanisms of invasion: "Six central questions about biological invasions to which NEON data science is poised to contribute."
Why Care About Biological Invasions?
Invasive species are a problem in almost every ecosystem—and the common denominator for most biological invasions is human activity. As humans move and transport goods across the Earth, we introduce non-native plant, animal, microbial, and other species everywhere we go, intentionally or unintentionally. Under certain conditions, these introductions can become a biological invasion.
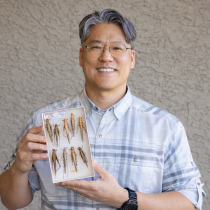
Dr. Nathan Gill, an assistant professor of Natural Resources Management at Texas Tech University, explains, "A lot of times, people mistakenly assume that any time a species is in a place where it is not native, that constitutes an invasion. But in science, it is important to be more precise. A biological invasion is when a non-native species becomes established in a new area and is having an impact in the community or introducing ecological change." Gill co-led development of the paper with Adam Mahood of the University of Colorado – Boulder.
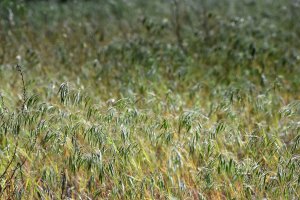
That impact can take a lot of forms, from displacing or directly harming native species to changing ecological processes like fire patterns. In the West, cheatgrass—an annual native to Europe, eastern Asia, and northern Africa —has spread widely across the Great Basin states, displacing native perennial grasses and forbs that once dominated the prairie landscapes. It also creates ideal conditions for wildfires to spread, providing large volumes of dry biomass that have changed fire patterns throughout the region.

Invasive cheatgrass. Photo credit: Arches NPS
Other examples abound across the continent. In the East, the emerald ash borer—brought to the continent on shipping pallets—has destroyed tens of millions of ash trees, pushing the most common species of the beloved hardwood to the edge of extinction. Escaped ornamental plants such as Japanese honeysuckle and purple loosestrife have transformed landscapes across the continent. Animals, too, ranging from mollusks to wild boar are impacting ecosystems in ways that we are still working to understand.
The changes introduced by invasive species directly impact the way ecosystems function and the ecosystem services they provide. Gill says, "We depend on the natural environment for so much, and invasive species are one way those things we rely on are changing very rapidly. We're often focused on habitat and biodiversity, but all of the ecosystem services we rely on—such as clean water, carbon sequestration, and so on—can potentially be impacted when invasive species come in and change the way that ecosystem functions."
To make matters more confusing, most ecosystems across the continent are facing not just a single biological invasion, but dozens, which may include plants, fungi, insects, birds, mammals, and microbes. These species interact with each other and with native species in complex ways that make predicting their overall impact difficult.
Understanding the Mechanisms and Impact of Biological Invasions
Invasion ecology is a branch of ecology concerned with understanding the mechanisms and impacts of biological invasions. "Mechanisms" refers to the nuts and bolts of how invasions happen, with questions such as: what are the environmental predictors of an invasion; does high native biodiversity provide a buffer against invasion or is it an indicator that the environment will also allow diverse invasive species to thrive; and how can we better understand the rate of spread of an invasion? "Impacts" refers to the effects on ecosystem composition and functions. Critical questions include: what are the long-term effects of biological invasion; how do the impacts of invasion vary across environmental gradients such as elevation, temperature, or moisture availability; and how do ecosystems respond to multiple simultaneous invasions?
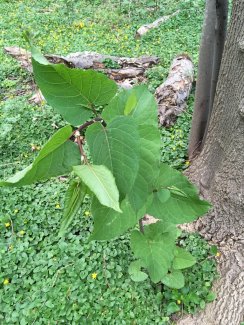
Giant knotweed - an invasive plant in Wisconsin. Photo credit: iNaturalist.
Gill and his coauthors examined the ways that NEON data could be used to answer important questions in invasion ecology. The paper grew out of a conversation at a breakout group at the NEON Science Summit in 2019. Gill's primary research interest is fire ecology, but he welcomed the opportunity to join the invasion ecology group. The breakout group developed into a year-and-a-half-long collaboration to explore various use cases for applying NEON data to invasion ecology.
The paper ultimately explores four potential use cases for NEON data aligned to pieces of some of the "big questions" in invasion ecology. The case studies used data from four NEON field sites in the Desert Southwest (D14), Great Basin (D15) and Southern Rockies & Colorado Plateau (D13) Domains: Onaqui (ONAQ) and Moab (MOAB) in Utah, Santa Rita Experimental Range (SRER) in Arizona, and Jornada (JORN) in New Mexico. These regions are all experiencing profound ecosystem change due to invasive grasses.
- Case Study I explored relationships between native species richness, non-native species richness and invasion probability at the plot, site, and regional scales.
- Case Study II looked at spatial patterns of landscape features (such as transportation corridors and barriers) as predictors of biological invasions.
- Case Study III examined correlations between nitrogen availability and non-native plant cover at the site and regional scales.
- Case Study IV investigated the potential for phenocam imagery to be used to distinguish biological invaders from native species based on their different "greenup" and "browndown" timings.
While these cases all focus on invasive terrestrial plant species, similar questions could be asked using NEON data for ground beetles, mosquitos, ticks, small mammals, birds, and aquatic organisms. Gill says, "One of the exciting things about the NEON data is just how much of it there is—both in the number of different variables measured and the spatial and temporal coverage of each variable! There are so many different directions you could take these questions."
Using NEON Data for Invasion Ecology
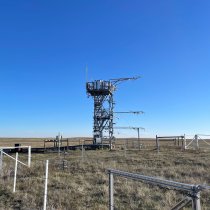
Gill believes that the NEON program is uniquely positioned to help researchers explore questions in invasion ecology. While their current case studies focus on the mechanisms of invasions, the 30-year timescale of the Observatory will, in time, enable ecologists to explore impacts more deeply as well. He says, "It's really helpful that we have this network of Observatories across the continent, all collecting the same kinds of data in a consistent way. An individual PI could never collect data at this scale, frequency, and level of precision. It allows us to scale precise data about invasions across much broader spatial and temporal scales to answer a wider range of questions."
One aspect that excites him is the ability to look at data at different spatial scales and across different types of ecological gradients, such as elevation or land use. He says, "One of the interesting findings in invasion ecology is that when you ask the same question at different scales, you sometimes get different answers. The nested spatial design of the NEON program, with plots inside of field sites inside of eco-domains, allows us to tease out those relationships."
For example, at the individual plot level, high native species biodiversity may have a protective effect against invasion. At the site or regional level, high native biodiversity may be positively correlated with invasive species diversity, suggesting that at broader scales, the same factors that support native species biodiversity also allow more invasive organisms to thrive.
Over the three-decade life of the Observatory, ecologists will be able to use NEON data to study how invasions unfold over time and the long-term impacts of different kinds of invasions. The NEON program also will enable researchers to examine correlations between invasive species presence and abundance and climate change.
Gill hopes that the paper will provide other researchers with ideas for using the NEON data. The authors include best practices and tips for first-time NEON data users. He says the volume of data available through the NEON program can be overwhelming at first, but stresses that users will find plenty of help on the NEON Data Portal and in the user community.
"It's a great open-source community," he says. "Regardless of what you want to study, you'll find help and people to collaborate with. Don't be afraid to reach out and connect with potential mentors and collaborators. The NEON program provides a wonderful opportunity to get involved with a community of data users who are doing some really creative work in ecology."