NEONiso R Package Simplifies Atmospheric Isotope Data Calibration
April 10, 2024
Atmospheric isotopes of carbon and oxygen can be used to study changes and variability in carbon fluxes and water cycles. Using isotopic data from NEON is one way that scientists can harness Observatory resources to look into these markers of ecosystem change and health.
An R Package developed by Dr. Rich Fiorella – a staff scientist at Los Alamos National Laboratory (LANL) – calibrates atmospheric stable isotope data, enabling comparative analysis across NEON sites and the development of derived data products. The NEONiso R Package is available on the Comprehensive R Archive Network (CRAN) and GitHub and has been incorporated into the NEON data processing pipeline for the carbon isotope data product (DP1.00036.001).
In addition to his work at LANL, Fiorella serves as the Chair of the NEON Technical Working Group for atmospheric isotopes and sits on the NEON Science, Technology & Education Advisory Committee (STEAC).
What Are Isotopes, and What Can They Tell Us About Ecosystems?
Isotopes are variants of chemical elements that have the same number of protons but different numbers of neutrons in their nuclei. This gives them a slightly different atomic weight than the “standard” atom. In the atmosphere, gases such as carbon dioxide (CO2) and water (H2O) can contain different isotopes of carbon (C), hydrogen (H) and, oxygen (O). The isotope ratios naturally vary in atmospheric gases based on variables such as temperature, precipitation patterns, and ecosystem dynamics, reflecting the complex interactions between the Earth’s surface, the biosphere, and the atmosphere.
Stable isotopes of water and carbon—that is, those that do not decay over time—can be used to trace environmental and ecological processes, study past and present climate conditions, and analyze water cycles and carbon fluxes.
- Oxygen in water molecules (and carbon dioxide) may contain oxygen-16 (16O), the standard form, or oxygen-18 (18O), a stable isotope with two extra neutrons (making it heavier). Hydrogen in water may be either 1H (the standard form, with no neutrons) or 2H (with one neutron), also known as deuterium.
- Stable isotopes of carbon in CO2 include carbon-12 (12C), the most abundant form, and carbon-13 (13C), with one extra neutron.
Studying the ratios of stable isotopes in atmospheric gases can help us understand how water and carbon are moving through the environment. For example, plants prefer to uptake 12C over 13C, so studying the change in the ratios of carbon isotopes in atmospheric fluxes can be used to analyze the rates of photosynthesis and respiration in ecosystems, assess the health and productivity of vegetation, and monitor the contributions of different carbon sources and sinks. Isotopes in water vapor help trace water through different parts of the water cycle, such as soil evaporation, transpiration, condensation, and precipitation.
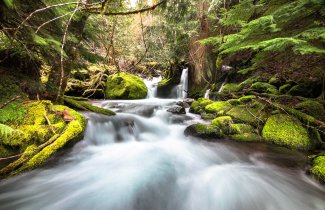
McRae Creek flows through the lush and mossy HJ Andrews Experimental Forest in central Oregon.
NEON collects atmospheric stable isotope data for both carbon and water; these are available as part of the bundled eddy covariance data product. “The NEON Eddy Covariance towers measure net fluxes of water and carbon between the land and the atmosphere,” explains Fiorella. “But if I’m a modeler or ecologist, I might want to know more about specific processes contributing to this net flux—for example, to look at just the photosynthesis fluxes or just the respiration fluxes. Or I might want to know how much water is being taken up by plants versus evaporating from the soil. Partitioning these net fluxes into gross fluxes is one application of these isotope tracers that there has been a lot of interest in.”
Stable isotope ratios are also available in the NEON Data Portal for groundwater, surface water, precipitation, soil, roots, litter, and foliar samples. This allows researchers to trace water and carbon through the ecosystem. “The NEON isotope data is a unique data stream,” says Fiorella. “While there are other flux tower networks, like AmeriFlux, NEON is the only network I am aware of that is collecting isotope tracers in a standardized way, focusing on ecosystem fluxes and associated with flux towers, at a continental scale.”
NEONiso: Calibrating Atmospheric Stable Isotope Data Across NEON Sites
Fiorella started working on the NEONiso R Package in 2018 while he was a postdoc at the University of Utah (UU). The work was funded by a U.S. National Science Foundation (NSF) Macrosystems Biology award in support of research into water partitioning in ecosystems using NEON data. The NEON towers provide flux data that represents both transpiration from plants and soil evaporation. Fiorella and his collaborators wanted to use stable isotope data to estimate transpiration alone. To do this, they first needed to calibrate the NEON stable isotope data.
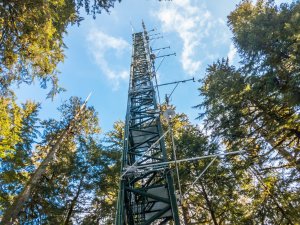
Isotope ratios are measured at each site using Picarro Cavity Ring-Down Spectrometers (CRDS), located in the instrument hut, which sample air from inlets on each of the tower measurement levels. The instruments provide highly precise trace gas analysis. However, the instrument measurements do “drift” over time. Instruments are calibrated once a year against a reference sample; to account for day-to-day drift, a reference sample is measured daily at each site. These reference samples are based on internationally-recognized standards for water and carbon isotope ratios that act as a baseline for isotope ratio studies. The international water isotope reference standard is known as Vienna Standard Mean Ocean Water (VSMOW), and the international carbon isotope reference is known as Vienna Pee Dee Belemnite (VPDB). Looking at the difference between the known values of the reference sample and the actual measurement provided by the instrument allows researchers to calculate instrument drift. That calculation can then be used as a correction factor when analyzing isotope ratio data from atmospheric samples.
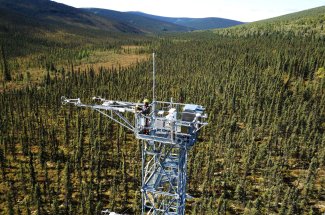
Flux tower at the BONA field site
The NEONiso R Package automates this calibration work. Without this software, researchers would have to manually correct each data point to enable comparison of isotope data across sites and across time.
The initial R package took Fiorella a year to develop, and he has continued to refine the code since. Currently, he is working on refining the water isotope calibration code to support a Department of Energy Office of Science Early Career Project. In the future, he hopes to continue to develop code to automate the production of derived data products based on stable isotope analysis.
Fiorella worked with Drs. Natchaya Pingintha-Durden and Chris Florian at NEON to add the R package to the NEON data pipeline, which was completed prior to data reprocessing for NEON’s 2024 Data Release. More details on data release can be found through the NEON Data Notification.
Get Started with the NEONiso R Package
The NEONiso R Package is freely available on CRAN and GitHub for researchers interested in stable atmospheric isotopes. The NEONiso Quickstart provides helpful information to get users up and running with a local copy of calibrated NEON atmospheric isotope data. NEON isotope data can be found through the NEON Data Portal.