The goal of neonhs is to make data from the National Ecological Observatory Network (NEON) Airborne Observation Platform (AOP) hyperspectral instrument easier to use. It allows you to efficiently extract spectra from spatial point locations, without worrying about the details of how the hyperspectral data are structured and stored.
After completing this tutorial, you will be able to:
Define hyperspectral remote sensing.
Explain the fundamental principles of hyperspectral remote sensing data.
Describe the key attributes that are required to effectively work with
hyperspectral remote sensing data in tools like R or Python.
Describe what a "band" is.
Mapping the Invisible
About Hyperspectral Remote Sensing Data
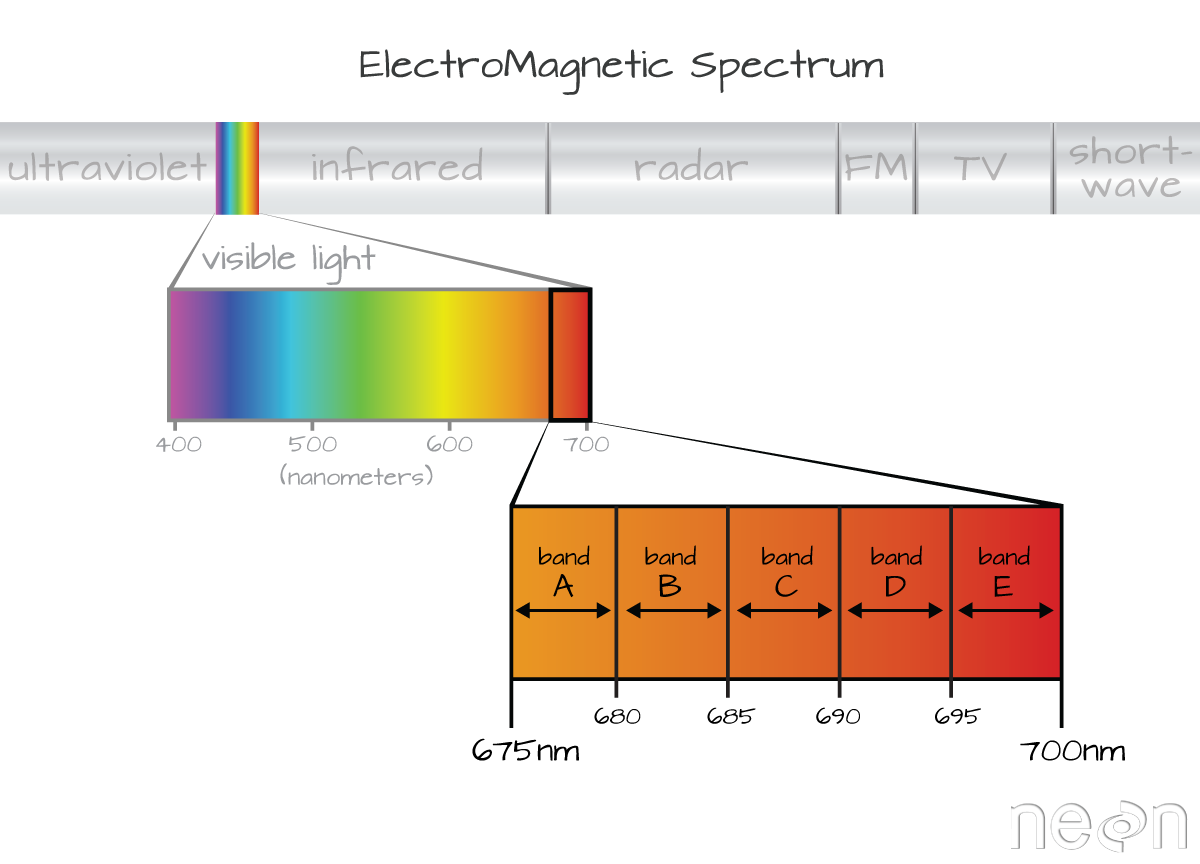
The electromagnetic spectrum is composed of thousands of bands representing
different types of light energy. Imaging spectrometers (instruments that collect
hyperspectral data) break the electromagnetic spectrum into groups of bands
that support classification of objects by their spectral properties on the
earth's surface. Hyperspectral data consists of many bands -- up to hundreds of
bands -- that cover the electromagnetic spectrum.
The NEON imaging spectrometer collects data within the 380nm to 2510nm portions
of the electromagnetic spectrum within bands that are approximately 5nm in
width. This results in a hyperspectral data cube that contains approximately
426 bands - which means big, big data.
Key Metadata for Hyperspectral Data
Bands and Wavelengths
A band represents a group of wavelengths. For example, the wavelength values
between 695nm and 700nm might be one band as captured by an imaging spectrometer.
The imaging spectrometer collects reflected light energy in a pixel for light
in that band. Often when you work with a multi or hyperspectral dataset, the
band information is reported as the center wavelength value. This value
represents the center point value of the wavelengths represented in that band.
Thus in a band spanning 695-700 nm, the center would be 697.5).
Imaging spectrometers collect reflected light information within
defined bands or regions of the electromagnetic spectrum. Source: National
Ecological Observatory Network (NEON)
Spectral Resolution
The spectral resolution of a dataset that has more than one band, refers to the
width of each band in the dataset. In the example above, a band was defined as
spanning 695-700nm. The width or spatial resolution of the band is thus 5
nanometers. To see an example of this, check out the band widths for the
Landsat sensors.
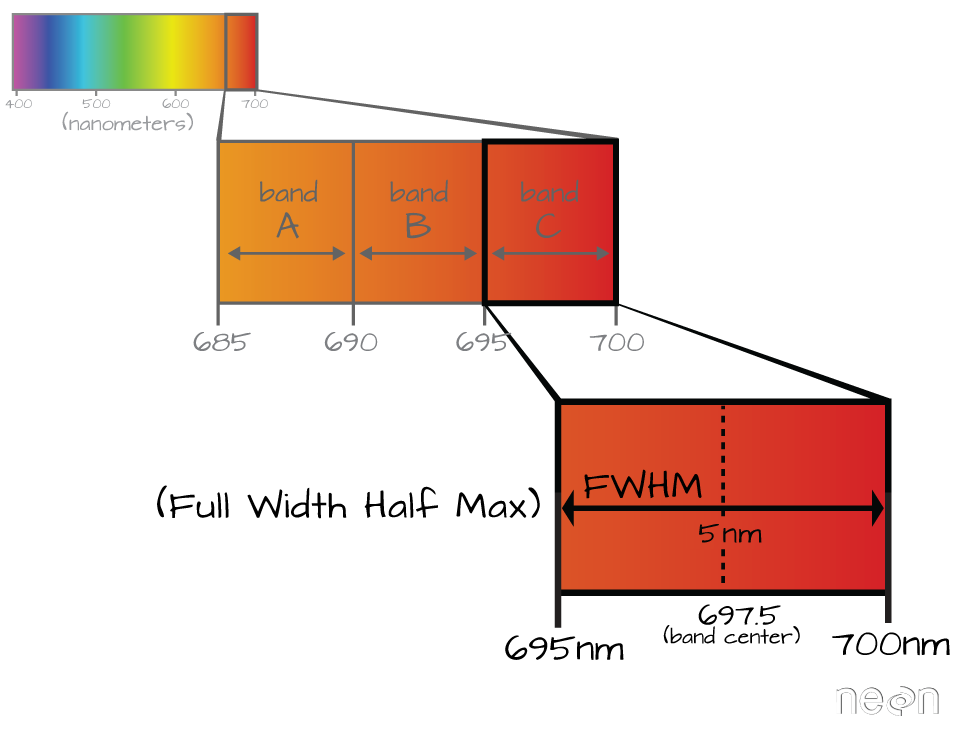
Full Width Half Max (FWHM)
The full width half max (FWHM) will also often be reported in a multi or
hyperspectral dataset. This value represents the spread of the band around that
center point.
The Full Width Half Max (FWHM) of a band relates to the distance
in nanometers between the band center and the edge of the band. In this
case, the FWHM for Band C is 5 nm.
In the illustration above, the band that covers 695-700nm has a FWHM of 5 nm.
While a general spectral resolution of the sensor is often provided, not all
sensors create bands of uniform widths. For instance bands 1-9 of Landsat 8 are
listed below (Courtesy of USGS)