Case Study
Looking for Missing Carbon in the Forest Canopy
December 11, 2019
Where does carbon dioxide (CO2) in the atmosphere go? Understanding how carbon cycles between the atmosphere and terrestrial systems is critical for building accurate models of atmospheric CO2 buildup and climate change. But right now, there are still many unanswered questions about carbon cycling—and the numbers in our current models don't add up.
Kyla Dahlin, an Assistant Professor in the Michigan State University (MSU) Department of Geography, Environment, and Spatial Sciences, is looking for answers in the forest canopy. Her team is using Airborne Remote Sensing data from five NEON project sites to develop detailed 3D maps of forest structure. Their work, which was funded by the National Science Foundation (NSF), could provide new insights into the carbon storage potential of forests.
Measuring the Carbon Storage Potential of Forests
Forests are an important "carbon sink"—that is, a natural system that absorbs CO2 from the atmosphere and stores it for an extended time. During photosynthesis, plants take CO2 out of the atmosphere and combine it with water and energy from the sun to create sugars for growth. The carbon becomes part of the plant, and excess oxygen is released back into the atmosphere.
The amount of carbon that a plant can absorb and store is directly related to its potential for photosynthesis. Photosynthetic capacity is commonly estimated by measuring the amount of nitrogen (N) in leaves. Nitrogen is a major component of chlorophyll, the compound that allows plants to absorb energy from sunlight to drive photosynthesis.
Nitrogen can be measured directly, by analyzing collected leaves in the lab. But it can also be measured indirectly using remote sensing technologies. Chlorophyll absorbs and reflects light at specific wavelengths, giving living plants their green color. The amount of light reflected by the leaf at different wavelengths is related to photosynthetic capacity and nitrogen content.
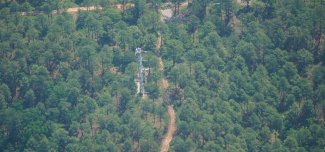
Overhead view of the TALL tower within the forest canopy
Airborne remote sensing data allow scientists to estimate vegetation cover and photosynthetic capacity on a large scale—for whole forests and ecosystems instead of tree by tree. The NEON project allows the estimation of canopy Nitrogen using a hyperspectral imaging spectrometer mounted on the Airborne Observation Platforms (AOPs). The NEON Imaging Spectrometer (NIS) measures reflected light energy in narrow spectral bands ranging from 380 to 2500 nm (the human eye can only see from 400 to 700 nm). This produces a hyperspectral image that can be used to create detailed maps of forest canopy chemistry. These data can then be used to estimate how much photosynthesis is taking place and how much carbon is being absorbed from the atmosphere.
The Importance of Vertical Structure for Carbon Storage Potential
This sounds like a straightforward process, but estimates of photosynthesis and carbon uptake created using canopy measurements don't always add up. Models created using these measurements may not correlate well with actual observations of carbon exchange between plants and the atmosphere taken using flux tower instruments.
Kyla and her colleagues believe that vertical forest structure could be a missing part of the equation. Most remote sensing measurements only look at the top layers of the forest, where leaves are directly exposed to sunlight. Many models using these data assume that leaf structure, density and photosynthetic capacity are homogenous within a vertical section of forest. But simple observation tells us that this is not true: forests have a complex 3D structure underneath the top canopy layer.
Vegetation type and density in the understory can vary widely between different forest types and even within a single forest. There is also a lot of variation between leaves on individual trees. Leaves at the top of the canopy, where they get maximum sunlight, are thicker and contain more nitrogen, giving them more photosynthetic capacity per square inch than leaves found closer to the ground. On the other hand, leaves from lower in the forest canopy tend to be bigger and thinner to maximize the surface area they have to collect sunlight that filters down from the top.
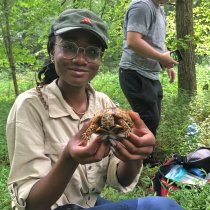
Field researchers can get an idea of forest structure using direct observations. These include taking leaf samples from different vertical layers of the forest and taking pictures looking straight up from the forest floor to estimate total leaf area index (total amount of leaf matter in the canopy per square meter of ground). But these methods are time consuming and expensive. To build models of forest 3D structure on a large scale, Kyla and her team turned to another method: airborne LiDAR.
Creating Models of 3D Forest Structure Using LiDAR
LiDAR (Light Detection and Ranging) is a remote sensing instrument that uses reflected light from a rapidly firing laser to create detailed maps of the elevation and structure of landscape features. Unlike cameras or hyperspectral imaging instruments, LiDAR is able to peek beneath the forest top canopy to get information about the structure of the vegetation in different vertical layers. Researchers can use LiDAR to build detailed 3D models of forests that show how vegetation structure and density change both vertically and horizontally.
Kyla's project uses LiDAR and hyperspectral data from AOP flyovers at five NEON field sites: Talladega National Forest (TALL) in Alabama, Mountain Lake Biological Station (MLBS) in Virginia, Oak Ridge National Lab (ORNL) in Tennessee, Smithsonian Environmental Research Center (SERC) in Maryland, and Harvard Forest (HARV) in Massachusetts. These sites all represent forested ecosystems in the Eastern United States. The work was supported in part by an NSF MSB-ECA grant. Scott Stark of MSU and Shawn Serbin of Brookhaven National Laboratory are co-principal investigators for the project, and graduate student Aaron Kamoske led fieldwork efforts and development of the first technical paper.
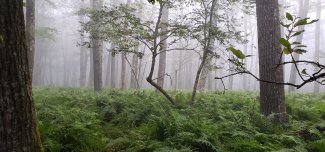
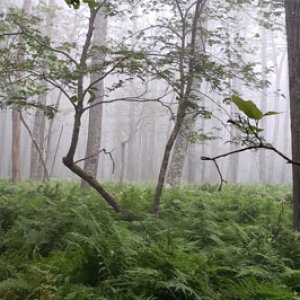
Forest at the MLBS field site
The team collected leaf samples and field measurements of leaf area index within different vertical layers to determine how well the remote sensing data correlated with data collected on the ground. Field collection was timed to occur at the same time as the AOP flyover at each site. Comparisons of the data showed that 3D models created using LiDAR data provide a high degree of accuracy in mapping variations in vertical forest structure.
Building Better Models of Carbon Cycling
This study is an important step towards the use of remote sensing data to build better models of the carbon storage potential of forests. LiDAR measurements from airborne platforms or satellites enable study of forest systems on larger scales than are possible using direct field measurements alone. Understanding how 3D forest structure is related to the photosynthetic capacity of a forest would allow researchers to calculate the impact of forests on carbon cycling on regional, continental or even global scales with much higher levels of certainty and precision.
However, there are several additional steps needed to get there. More work needs to be done to determine exactly how forest structure impacts photosynthetic capacity and carbon cycling. A new study at the University of Michigan Biological Station (UMBS) could provide additional insight. UMBS has more than 100 years of data on reforestation, including patches of forest that have undergone different controlled cutting and burning protocols and, as a result, have radically different 3D structures. They also have a flux tower to measure carbon fluxes directly. The new project leveraged the NEON AOP, contracted under the NEON Assignable Assets Program, to gather hyperspectral and remote sensing data over UMBS. Comparing the remote sensing data with flux tower measurements will help the team to refine their models of forest structure and carbon cycling.
Kyla would also like to look at the year-to-year variability of forest structure and trends over time at the five NEON sites in the study. Eventually, she would like to expand this work to other NEON sites and ecosystems. She says, "The NEON project is providing unprecedented amounts and types of data that will enable us to understand spatial and temporal patterns in ecosystems across the U.S. Before, most of the research in this field was conducted by individual investigators, so there isn't a lot of comparability between regions or repetition across time to allow us to see patterns. Knowing that we will have data with this kind of scope and detail, and that it will be available year after year, allows us to analyze trends in ways never before possible."
Ultimately, Kyla hopes that her study will lead to a better understanding of the importance of vertical forest structure and new, more accurate models of the carbon capture and storage potential of different types of forests. "If we want to predict the future state of the planet using Earth system models, and make decisions based on those models, we have to make sure the models are as accurate as possible," she explains. "Using remote sensing data to model forest structure could be a way forward."