Research Highlight
What's All This Dew Doing? Maybe More Than You Think
July 10, 2019
If you wake up early on a cool summer morning, you may find a landscape transformed by thousands of glittering dewdrops. While these tiny droplets of water are easy to take for granted, they do a whole lot more then get your socks wet when you walk through the lawn. Dew has an important role to play in ecosystem health and resilience.
A new study led by François Ritter, a Ph.D. candidate at the University of Illinois–Chicago Department of Earth and Environmental Sciences, provides important insights into the frequency of dew formation across the U.S. Dew Frequency Across the U.S. from a Network of In Situ Radiometers, co-authored by Max Berkelhammer and Daniel Beysens, used sensor data from NEON terrestrial field sites to examine the conditions that lead to dew formation in different ecosystems. The findings could help ecologists better predict how ecosystems will respond to increased drought frequency.
The Science of Dew Formation
Dew forms when water vapor in the atmosphere condenses onto cool surfaces. This is the same process that you witness on your bathroom mirror when you take a shower: water droplets form when warm, moisture-heavy air comes in contact with the cooler surface of the mirror.
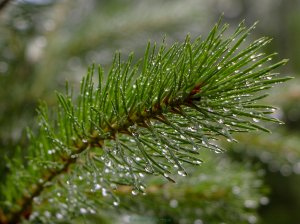
Dew on plants
In natural environments, dew typically forms on grass and leaves overnight, often when days are warm and nights are cool. When the sun goes down, air and surfaces heated up by solar radiation during the day begin to cool. Cooler air can't hold as much water vapor as warmer air; as the temperature drops, the rate of condensation exceeds the rate of evaporation and water droplets form. The temperature at which this occurs is known as the dew point. Dew (or frost, if temperatures are below freezing) forms on surfaces that are cooler than the surrounding air.
So, What Does Dew Do, Anyway?
Most studies of the water cycle in ecosystems focus on the water brought into the system through precipitation (rain and snow), groundwater and surface water. But dew also has an important role in many ecosystems.
François explains, "Dew is not enough by itself to keep plants alive long term, but during periods of drought these secondary processes become more relevant. Dew may help some species survive drought conditions."
Dew reduces water stress for plants by three main processes.
- Water deposited on grass and leaves reduces transpiration (the release of water into the atmosphere through pores in the plant's leaves). Dew forms a protective barrier on the leaf; transpiration will not occur until the dew evaporates. This means that the plant retains more moisture in its cells, making it more resilient in hot, dry conditions.
- As dew evaporates, it cools the plant down in much the same way that evaporating sweat cools your body on a hot day. This reduces heat stress in very hot environments.
- Some species, especially desert plants, can actually absorb water directly through their leaves. For these species, dew is a direct source of hydration.
Dew may also play an important role in seed germination. High levels of dew in grasslands could provide the moisture needed for different types of seeds to germinate, perhaps even creating conditions that support the transition from grasslands to forests.
Calculating the Frequency of Dew Formation Using NEON Micrometeorology Data
Dew frequency depends on a number of variables, including air temperature, relative humidity, surface temperatures and wind speed. François says, "Conditions have to be just right. If the wind speed it too high or too low, or if the air and surface temperatures aren't in the right range, dew will not form."
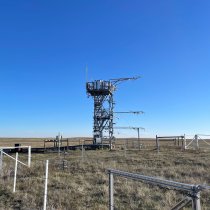
François used data from micrometeorology/flux towers at NEON’s terrestrial field sites for the dew study, which provide a variety of sensor measurements including relative humidity, wind speed, air temperature and canopy temperature. The canopy temperature is measured using infrared thermal radiometers (IR radiometers) mounted on the towers at each site. IR measurements are taken at different levels of the tower up through the canopy.
Dew frequency for each site was extrapolated based on the sensor data. The method was previously validated by comparing sensor data with direct observation of dew formation, which provided a high level of confidence that dew formation could be inferred from these indirect measurements.
The study looked at data from 11 grassland ecosystems and 19 forest ecosystems over a two-year period from 2015 to 2017. Looking at sensor data in 30-minute increments, François was able to calculate the number of nights that dew formed at each site and the duration of each dew event. Dew yield can be estimated based on the duration of dew-producing conditions.
The data showed that the frequency of dew formation in grasslands varied considerably based on nighttime relative humidity, ranging from just 15% to 95% frequency across the 11 NEON sites. Dew formation in forests was much more homogenous, with dew forming 25% of nights on average across the 19 forested sites. Dew formed most frequently at the canopy top in grasslands and at lower levels of the canopy in forests.
The study demonstrated how dew formation, direction and yield can be estimated from in situ sensor data. These methods will enable researchers to look at dew formation on scales not easily achieved using traditional observational methods, which require researchers to directly observe and collect dew on site.
This is the first study to look at dew formation using sensor data at a continental scale. "The NEON data are invaluable for continental-scale studies like mine," François explains. "Data are collected using the same methods and timescales at every site, so we can easily compare results across the different ecosystems."
Dewdrops and Climate Change: Dew Really Does Matter
As temperatures warm and precipitation patterns change in many regions, dew formation could play an increasingly important role in ecosystems. Models predict an increase in drought frequency and intensity in many parts of the U.S., along with more days of extreme heat in the summer. Dew may help plants survive these changing long-term weather conditions.
François sees his study as the starting point for more research on global dew formation. He is now taking his own research further with a study focused on the interrelationships between rainfall, dew formation and moisture in the air. This study will use data from a global network of weather stations.
These studies could help researchers update change models to include the effects of dew in different ecosystems. Knowing how much dew is produced globally, and understanding the conditions under which it forms, could also predict the yield of dew condensers used for water production in some parts of the world.
"Now, we have a tool that allows us to extrapolate dew formation from sensor data, which will give us a better picture of what dew formation looks like globally," he says. "This will help us model how ecosystems will respond to water stress in the future and predict which ecosystems will survive."