Research Highlight
Watching the Diurnal Dance of Woody Plants
January 19, 2022
When Dr. Alesia Hallmark of the University of New Mexico started looking through phenocam data, the last thing she expected to see was nighttime movement among the branches of woody plants. But rhythmic and predictable branch movement was exactly what she did see in creosote bushes in New Mexico—even in dead branches. Now, she's looking through NEON phenocam data to see if she can document the phenomenon in other sites and species. Her results, published in a recent Ecosphere paper, could upend common assumptions about movement—or lack thereof—in woody species.
An Accidental Discovery
Diurnal (daily) movement has been documented among many plant species. Many plants demonstrate circadian rhythms in movement related to light or temperature changes. For example, leaves may rotate to follow the sun, or flowers may close at night.
However, woody branches have long been believed to be static unless moved by outside forces such as wind. Hallmark says, "Even in my undergraduate botany textbook, I was taught that the wood in a tree is like a brick foundation. It does not move." It is only recently that some researchers (such as Putonnen and Zlinszky) have started to document evidence to the contrary. Therefore, it was quite surprising to Hallmark when she discovered evidence of woody branch movement in phenocam data from the Sevilleta National Wildlife Refuge and Long-Term Ecological Research (LTER) site in central New Mexico.
She describes the discovery as "a complete accident." Hallmark made the discovery as a grad student in the Litvak Lab at the University of New Mexico. (She is now the Field Station Manager at the UNM Sevilleta LTER site. She was a NEON Postdoctoral Fellow in 2020.) The Litvak Lab, run by Dr. Marcy Litvak at UNM, was an early adopter in the use of game cameras as phenocams to observe plant phenology. Hallmark was tasked with deleting extraneous photos from five years' worth of phenocam data to free up storage space. She says, "The first thing I realized is that the cameras had not been programmed correctly—they were taking photos not just in the day but also all through the night." The black-and-white infrared nighttime photos were not useful for phenological studies, but before deleting them, Hallmark decided to take a closer look.
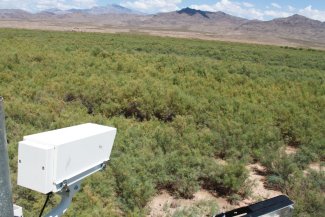
Example of a phenocam: a USGS phenocam installation near Mormon Mesa, NV, in 2011. The camera is aimed at plants to capture any changes in phenology over time. Photo credit: TimeScience (CC BY-NC 2.0)
"By looking through the photos very quickly in sequence, and without the distraction of color, it became very clear that the branches were moving in a very consistent way," she explains. "At first, no one believed me—they thought it was just the wind. But these creosote branches were all moving upward in a consistent way each night, even without wind."
She managed to convince her eventual coauthors that what she was seeing was indeed a real phenomenon. She put additional cameras and sensors up around creosote bushes at the site to document the movement from different angles and collect additional data. The results corroborated her findings: the creosote branches were moving.
Dancing Plants and Zombie Branches
Analysis of phenocam data showed that the creosote branches started moving upward in the afternoon, reaching their maximum height just before dawn. Branches began to move back downward at dawn, reaching their lowest height at midday. Hallmark and her coauthors looked at a variety of potential correlates for the branch movement, using data from the sensors and the flux tower at the LTER Sevilleta site. These sensors allowed them to correlate the branch movements with variables such as temperature, humidity, and light levels (both sunlight and moonlight). They also looked at vapor pressure deficit and measured stem water potential and within the branches. "We looked at every variable we could think of to look for something that could explain these movements," Hallmark says.
She was particularly fascinated to discover that the movement was not limited to living branches. Dead branches—or "zombie branches," as she came to call them—also followed the same diurnal pattern. An intense freeze event several years before had left quite a few dead branches behind, giving the team ample opportunity to study the zombie branch phenomenon.
These "undead branches" provided an important clue. Hallmark explains, "Since we were seeing the pattern in dead wood—and some of these branches were really dead—we figured it had to be something in the way the wood reacts passively with the air."
In the end, the strongest correlating factor for branch movement—both dead and alive—was humidity. Diurnal movements were strongly correlated with daily and weekly-biweekly cycles of relative humidity, temperature, and vapor pressure deficit. Somewhat surprisingly, movement did not seem to be correlated with stem water potential – a direct measure of water tension (negative pressure) within the plant – which was one of their initial hypotheses to explain the movement. Live branches tended to respond to changes in humidity and temperature more quickly than dead branches, but both sets of branches showed similar overall patterns. The researchers concluded that a mixture of both biotic and abiotic forces governed the branches' response to changes in humidity levels.
Woody Plant Movement at NEON Field Sites
Hallmark extended her study using data from the NEON phenocams. "I've looked through every single NEON camera to look for other examples of periodic cyclical movements," she says. Analyzing NEON phenocam data showed that the phenomenon was not limited to creosote bushes. Woody plants were dancing across many NEON field sites.
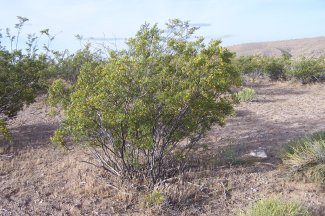
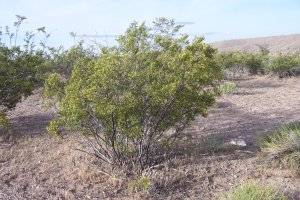
A creosote bush (Larrea tridentata). Photo credit: Aquila-chrysaetos (CC BY-NC 2.0).
Data from the NEON program provided an easy way for Hallmark to extend her research into different climate zones and ecosystems. "I realized that the NEON program was already collecting a lot of the same data we were looking at in the Sevilleta study, with the NEON flux towers and phenocams," she explains. "It gave me an opportunity to expand beyond our original site in New Mexico and see if we could recreate these results in different species and different climates."
So far, it appears that branch movement in woody plants is a widely occurring phenomenon—but the movement patterns seem to vary at different sites and in different species. Some species movements, for example, seem to follow more seasonal patterns rather than the diurnal pattern observed in creosote bushes in New Mexico. Hallmark suspects that this may point to a variety of mechanisms that could relate to woody branch movement in different species and locations. She says more work remains to be done to investigate these differences.
One potential implication for this work is the need to consider time of day when measuring plant height or morphology. Hallmark's work suggests that woody trees and shrubs may have considerably different shapes in the morning, evening, and night. These differences could explain results assumed to be data discrepancies, such as a measurement that suggests a tree has gotten shorter rather than taller over time. The difference could be in the time of day that the two measurements were taken. Measuring creosote bushes over the course of a day, for example, showed that plant volume could change by as much as 20% between morning and evening. "We need to stop looking at plants as static objects," Hallmark says. "These results have really changed the way I look at morphology data. It can change so much across a day or after a big event. We need to take that into consideration when we look at morphology data taken at different points in time."
Now, she's looking at other potential applications for phenocam data. For example, by extracting color data from the phenocam images, it may be possible to identify individual tree species within the data. Better differentiation of individual trees by species would allow researchers to look at differences in behavior by species. Hallmark says, "We can't just treat the tree canopy as homogenized data. We need to break it down by species and make sure there aren't any oddballs that act differently than the other species around them." This applies not just to studies of branch movement, but also more broadly. "These cameras allow us to see what players are in the ecosystem and in what proportion—for example, an ecosystem may be 90% spruce and 10% pine. When we detangle species information in the data instead of just looking at it as one sensor measurement, it allows us to see which species are actually doing the work in an ecosystem."
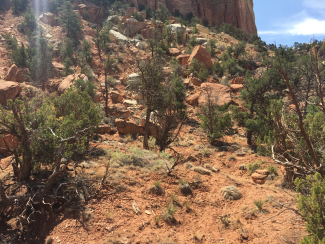
Juniper woodland in eastern Utah, near MOAB site. Photo credit: Chris Hakkenberg.
Hallmark is excited to see what other researchers may do with phenocam data from the NEON program. "The great thing about the NEON program is that it is open science, and the data is available to anyone," she says. "You don't necessarily know what discoveries will be made when you start looking through the phenocams or other NEON data products. NEON just puts all this data out there that the science community can use to see what discoveries can be made."
