The Roadmap for NEON Instrument Systems: Real-Time Monitoring and Predictive Analytics
January 27, 2021
The NEON program embodies simple principle: good science is built on good data. Many of the data products produced by the Observatory come from the Aquatic and Terrestrial Instrument Systems. Instruments on the NEON flux towers, soil arrays, and aquatic sensor systems collect continuous data even when NEON scientists can't get to the field.
However, ensuring data quality and continuity from this network of diverse and widely-distributed scientific sensors is a challenge. A new remote monitoring and near real-time alert system is helping NEON scientists rapidly detect and diagnose data anomalies that may indicate a problem with sensors or software. Currently, the team is in the process of identifying trends and characteristics in sensor failures that could soon allow them to predict when sensors will require maintenance and optimize field maintenance protocols. The changes have already substantially improved data quality for the instrument systems while saving hundreds of labor hours per Domain for the instrument system team and field staff.
A Flood of Data from Hundreds of Sensor Systems
The NEON instrument systems (IS) generate a vast amount of data. The Observatory generates approximately 20,000 separate data streams daily. These data streams are condensed into 74 distinct data products, 22 for the Aquatic Instrument Systems and 52 for the Terrestrial Instrument Systems. Automated instruments collect data continuously to capture patterns and cycles across timescales ranging from seconds to years. The automated instrument systems represent one of the three major data collection methods used by the Observatory, along with observational sampling and airborne remote sensing.
In situ sensors augment observational sampling with continuous data collection and precise measurements of a variety of biogeochemical, phenological, and meteorological indicators.
- Aquatic instrument systems (AIS) include groundwater wells, precipitation gauges, a phenocam, a riparian meteorological station, and in situ sensor stations to collect surface water quality, chemistry, temperature, and depth measurements.
- Terrestrial instrument systems (TIS) include soil sensor arrays (which measure soil moisture, temperature, and other physical and chemical properties at the surface and various depths) and micrometeorological towers. The towers are equipped with phenocams, a precipitation gauge, and a variety of other sensors to collect meteorological data and fluxes of carbon, water, and energy between the atmosphere and terrestrial ecosystems.
In all, these add up to dozens of different sensor technologies, streaming thousands of different readings each and every day. Each sensor has multiple data streams, including both the reading it is designed for and other indicators of instrument health. For example, a sensor sending temperature data from the flux tower may send fan and turbine voltage readings along with the recorded air temperature. These ancillary components, while not part of the final data product in the NEON Data Portal, are essential to maintaining data quality—and are especially prone to be overlooked. The flood of data generated by the Observatory Instrument Systems each day is simply more than any team can keep up with manually.
Maintaining Data Quality for Instrument Systems
In situ instrument systems must be hardy to hold up under all kinds of weather conditions and other stressors in the environment. Still, they require regular, routine maintenance and calibration. But even with the best of care, sensor systems can be damaged or knocked offline unexpectedly. For example, a nitrate sensor in a stream may become obstructed with debris, a tipping bucket (a type of precipitation gauge) may become clogged with falling leaves, or a vacuum pump used for collection of atmospheric gases may fail. Software bugs can also cause data anomalies or a failure to record data streams properly.

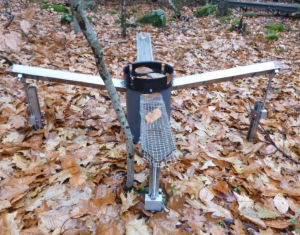
A clogged throughfall sensor in the field.
In the past, these problems may have gone undetected for weeks or even months, depending on how frequently field staff maintains that particular sensor. Josh Roberti, a NEON data scientist responsible for atmospheric data from the instrument systems, explains, "We realized that in addition to performing field maintenance protocols and swapping out sensors, field staff were spending a lot of their own time back at the office trying to analyze data manually and identify problems in the data streams. We estimated that this added up to dozens of hours of field staff time every week per Domain." In addition to being time consuming, this approach wasn't very effective; humans simply aren't well equipped to pick out sensor-related issues in thousands of data streams. For that, we need to turn to machines.
A Near Real-Time Data Quality Dashboard
Josh Roberti and Robert Lee, a geochemist and data scientist on the NEON instrument team, began working on the problem in 2019 when they realized how much time was spent trying to identify and resolve data quality issues for the instrument systems. They developed a near real-time dashboard for the NEON instrument systems that passively and remotely monitors instrument systems to help staff identify sensors that need immediate attention. The app is now used across all of the NEON Domains.
The system queries all of the data streams produced across the entire NEON Instrument System each day. The dashboard provides a window into instrument health and operating status on a 24-hour lag, allowing field scientists to quickly identify instruments that may be having problems. Daily "Domain Reports" are sent out by email with plain-English alerts for all of the issues detected in the field for the previous day. These daily emails help technicians spot issues right away without having to check the dashboard. The eventual aim is to have the alert system linked with NEON's ticketing system to ensure that issues are documented and save even more time for NEON staff.
Matt Schroeder, the Assistant Director of Field Science, appreciates having a remote tool that provides a single place to view the status of all instruments in the Observatory and the data being collected. "In the past, the engineering team paid attention to engineering issues and the science team paid attention to the science, and we weren't really unified in how we looked at the status of systems and the impact on the Observatory," he explains. "Now, all departments are looking at the same system and using the same language to talk about issues."
Matt especially appreciates the time the system saves for his staff, who are tasked with maintaining the instrument systems in the field. He says, "My team is responsible for troubleshooting, repairing, and exchanging sensors in the field. All of those things are helped and improved by having a tool that you can look at before you leave the office. Many of our sites are hours away from the Domain offices. Now we can get an idea of what is happening remotely and better prioritize our time in the field." The system was especially helpful during the 2020 sampling season, when travel restrictions due to COVID-19 limited the ability of researchers to get into the field for routine maintenance. Remote monitoring allowed researchers to see which instruments were still providing good data and prioritize corrective maintenance when a problem was detected.
The dashboard also gives both the science and engineering teams a clearer picture of data quality. The alert system lets the research and engineering teams know right away if a problem is detected with a data stream, such as a sensor that has malfunctioned and is sending nonsensical data. Matt says, "In the past, we really just looked at the quantity of data we were collecting—how many sensors were streaming data. We had limited insight into the quality of that data. This gives field staff a new way to monitor uptime."
A Roadmap for the Future: Predictive Analytics and NEON Instrument Systems
After the first six months of operation, the dashboard resulted in an 8% increase in data uptime and an 18% increase in data within calibration ranges. Josh and Robert credit this success to the hard work of the NEON field staff and their new alert system, which supports rapid response to detected data anomalies. Robert says, "The primary goal of the NEON program is to produce high-quality data for the science community. This system will have a large impact on data quality and the science coming out of NEON. I believe it is the most important thing I can be working on for the NEON program right now."
Josh and Robert are now working with additional scientists from across the IS team to optimize the code for different instruments and develop the predictive analytics features. Mike SanClements, the Research Lead for Terrestrial Instrument Systems, says, "Real-time monitoring has been critical to improving our quality assurance processes. This shows how the NEON program is continually working to improve the quality of our data for the science community."