NSF NEON | Open Data to Understand our Ecosystems logo

Main navigation

  • About Us
    • Overview
      • Spatial and Temporal Design
      • History
    • Vision and Management
    • Advisory Groups
      • Science, Technology & Education Advisory Committee
      • Technical Working Groups (TWGs)
    • FAQ
    • Contact Us
      • Field Offices
    • User Accounts
    • Staff

    About Us

  • Data & Samples
    • Data Portal
      • Explore Data Products
      • Data Availability Charts
      • Spatial Data & Maps
      • Document Library
      • API & GraphQL
      • Prototype Data
      • External Lab Data Ingest (restricted)
    • Samples & Specimens
      • Discover and Use NEON Samples
        • Sample Types
        • Sample Repositories
        • Sample Explorer
        • Megapit and Distributed Initial Characterization Soil Archives
        • Excess Samples
      • Sample Processing
      • Sample Quality
      • Taxonomic Lists
    • Collection Methods
      • Protocols & Standardized Methods
      • Airborne Remote Sensing
        • Flight Box Design
        • Flight Schedules and Coverage
        • Daily Flight Reports
          • AOP Flight Report Sign Up
        • Camera
        • Imaging Spectrometer
        • Lidar
      • Automated Instruments
        • Site Level Sampling Design
        • Sensor Collection Frequency
        • Instrumented Collection Types
          • Meteorology
          • Phenocams
          • Soil Sensors
          • Ground Water
          • Surface Water
      • Observational Sampling
        • Site Level Sampling Design
        • Sampling Schedules
        • Observation Types
          • Aquatic Organisms
            • Aquatic Microbes
            • Fish
            • Macroinvertebrates & Zooplankton
            • Periphyton, Phytoplankton, and Aquatic Plants
          • Terrestrial Organisms
            • Birds
            • Ground Beetles
            • Mosquitoes
            • Small Mammals
            • Soil Microbes
            • Terrestrial Plants
            • Ticks
          • Hydrology & Geomorphology
            • Discharge
            • Geomorphology
          • Biogeochemistry
          • DNA Sequences
          • Pathogens
          • Sediments
          • Soils
            • Soil Descriptions
    • Data Notifications
    • Data Guidelines and Policies
      • Acknowledging and Citing NEON
      • Publishing Research Outputs
      • Usage Policies
    • Data Management
      • Data Availability
      • Data Formats and Conventions
      • Data Processing
      • Data Quality
      • Data Product Revisions and Releases
        • Release 2021
        • Release 2022
        • Release 2023
      • NEON and Google
      • Externally Hosted Data

    Data & Samples

  • Field Sites
    • About Field Sites and Domains
    • Explore Field Sites
    • Site Management Data Product

    Field Sites

  • Impact
    • Observatory Blog
    • Case Studies
    • Spotlights
    • Papers & Publications
    • Newsroom
      • NEON in the News
      • Newsletter Archive
      • Newsletter Sign Up

    Impact

  • Resources
    • Getting Started with NEON Data & Resources
    • Documents and Communication Resources
      • Papers & Publications
      • Document Library
      • Outreach Materials
    • Code Hub
      • Code Resources Guidelines
      • Code Resources Submission
      • NEON's GitHub Organization Homepage
    • Learning Hub
      • Science Videos
      • Tutorials
      • Workshops & Courses
      • Teaching Modules
      • Faculty Mentoring Networks
      • Data Education Fellows
    • Research Support and Assignable Assets
      • Field Site Coordination
      • Letters of Support
      • Mobile Deployment Platforms
      • Permits and Permissions
      • AOP Flight Campaigns
      • Excess Samples
      • Assignable Assets FAQs
    • Funding Opportunities

    Resources

  • Get Involved
    • Advisory Groups
      • Science, Technology & Education Advisory Committee
      • Technical Working Groups
    • Upcoming Events
    • Past Events
    • NEON Ambassador Program
    • Collaborative Works
      • EFI-NEON Ecological Forecasting Challenge
      • NCAR-NEON-Community Collaborations
      • NEON Science Summit
      • NEON Great Lakes User Group
    • Community Engagement
    • Science Seminars and Data Skills Webinars
    • Work Opportunities
      • Careers
      • Seasonal Fieldwork
      • Postdoctoral Fellows
      • Internships
        • Intern Alumni
    • Partners

    Get Involved

  • My Account
  • Search

Search

Learning Hub

  • Science Videos
  • Tutorials
  • Workshops & Courses
  • Teaching Modules
  • Faculty Mentoring Networks
  • Data Education Fellows

Breadcrumb

  1. Resources
  2. Learning Hub
  3. Tutorials

Tutorials

Image
Banner for tutorials

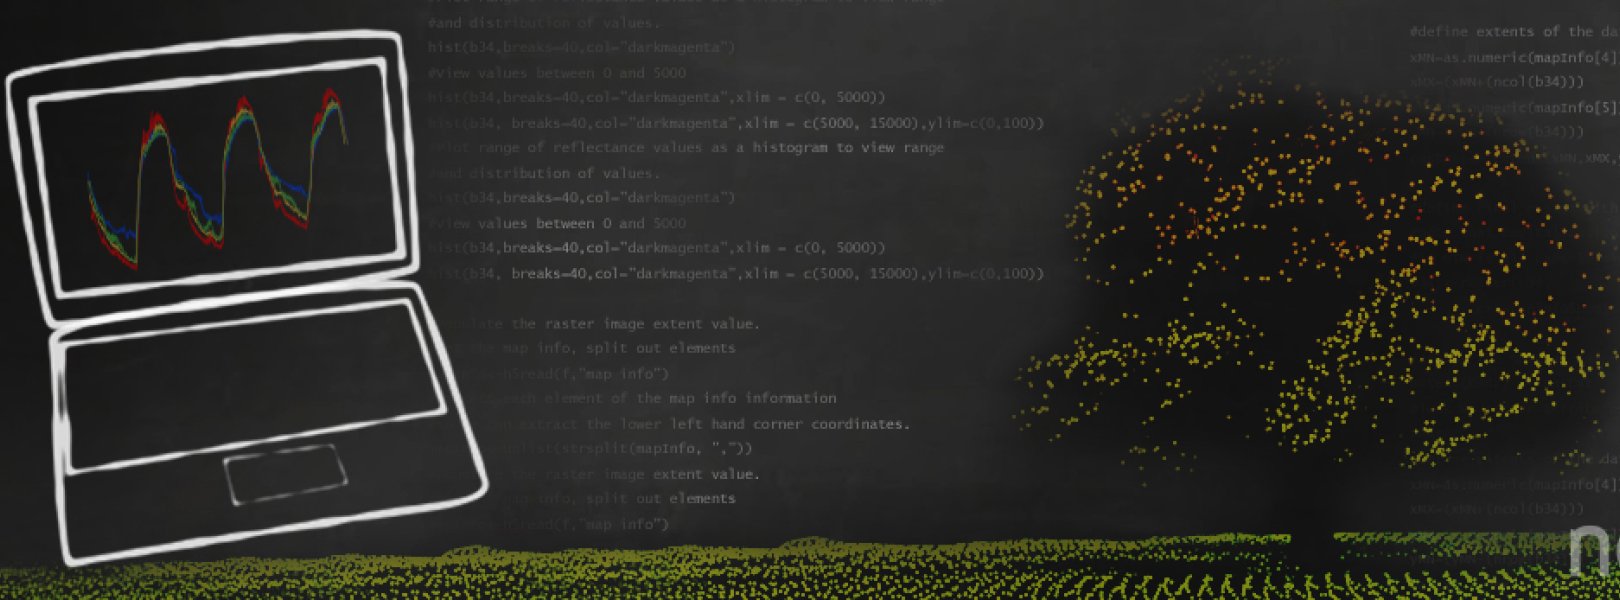
Looking to improve your data skills using tools like R or Python? Want to learn more about working with a specific NEON data product? NEON develops online tutorials to help you improve your research. These self-paced tutorials are designed for you to used as standalone help on a single topic or as a series to learn new techniques.

Code for all script based tutorials can be downloaded at the end of the tutorial. Original files can also be found on GitHub.

All materials are freely available for you to use and reuse. We suggest the following citation for tutorials: 
[AUTHOR(S), NEON (National Ecological Observatory Network)]. Data Tutorial: [TUTORIAL NAME]. [URL] (accessed [DATE OF ACCESS]). See Citation Guidelines for examples, and for guidance in citing data and code.

Tutorials

Start Tutorial

Work With NEON's Plant Phenology Data

1 hour
Learn to work with NEON plant phenology observation data (NEON.DP1.10055).
Start Tutorial

Work with NEON's Single-Aspirated Air Temperature Data

1 hour
This tutorial demonstrates how to work with NEON single-aspirated air temperature data. Specific tasks include conversion to POSIX date/time class, subsetting by date, and plotting the data.
Start Tutorial

Working With Raster Time Series Data in R

This series covers how to open, work with and plot with multi-band raster data and raster time series data in R using both plot and rasterVis levelPlot.
Series
3 part series
Start Tutorial

Working With Time Series Data Within a Nested HDF5 File in R

1.0 - 1.5 Hours
Explore, extract and visualize temporal temperature data collected from a NEON flux tower from multiple sites and sensors in R. Learn how to extract metadata and how to use nested loops and dplyr to perform more advanced queries and data manipulation.

Pagination

  • First page
  • Previous page
  • …
  • Page 2
  • Page 3
  • Page 4
  • Page 5
  • Current page 6
NEON Logo

Follow Us:

Join Our Newsletter

Get updates on events, opportunities, and how NEON is being used today.

Subscribe Now

Footer

  • My Account
  • About Us
  • Newsroom
  • Contact Us
  • Terms & Conditions
  • Careers

Copyright © Battelle, 2019-2020

The National Ecological Observatory Network is a major facility fully funded by the National Science Foundation.

Any opinions, findings and conclusions or recommendations expressed in this material do not necessarily reflect the views of the National Science Foundation.