Tutorial
Using the neonstore Package to Download and Store NEON Data
Last Updated: Apr 2, 2026
Data storage and management have important implications for scientific
reproducibility. This tutorial covers one possible workflow for managing
NEON data downloads reproducibly, using a community-developed R package,
neonstore.
NEON data are initially published as provisional, i.e. subject to change at any time and without notice. Data in the provisional state may be re-processed and re-published on an as-needed basis, usually due to data quality procedures. Starting in 2021, an annual static Release of NEON data is published, containing most or all NEON data up to a data-type-specific provisional lag time. Data in a Release are associated with a Digital Object Identifier (DOI) and do not change throughout the lifetime of the observatory.
For more information about Data Releases and NEON's data processing pipelines, see the Data Management pages on the NEON website, and the data pipeline videos on the NEON Science YouTube page.
Since NEON data may change over time, either between Releases or during the
provisional period, it's wise to keep the original data files used in a
particular analysis or paper, in addition to any subsequent updated versions
of those data files. The neonstore package offers a smooth, straightforward
way to do this, and handles the file organization for you.
In this tutorial, we'll download data from three data products, examine the
file structure neonstore places them in, and use the neonUtilities package to
extract and stack a subset of data from each data product.
Objectives
After completing this activity, you will be able to:
- Download and manage NEON data using the
neonstorepackage - Extract and stack data from your
neonstorearchive
Things You’ll Need To Complete This Tutorial
You will need a version of R (3.4.1 or higher) and, preferably, RStudio
loaded on your computer to complete this tutorial.
Install R Packages
-
neonstore:
install.packages("neonstore") -
neonUtilities:
install.packages("neonUtilities")
Additional Resources
Set Up R and Local Storage Location
First install and load the necessary packages.
##
## # install packages. can skip this step if already installed
## install.packages("neonstore")
## install.packages("neonUtilities")
##
## # load packages
library(neonstore)
library(neonUtilities)
##
By default, neonstore will choose a directory to save the downloaded
data. You can see where this is by checking the neon_dir()
setting:
neon_dir()
Optional: Set the environment variable NEONSTORE_HOME to override
the default directory and specify a file location you want to use
to store your NEON data files.
# set to the file path you want to use
Sys.setenv(NEONSTORE_HOME = paste(getwd(),
                                  "/data/neonstore",
                                  sep=""))
Note that you can't use ~ for file expansion in the environment variable.
You can also set NEONSTORE_HOME as a permanent environment variable, to
avoid having to set it each time you use it. For instructions on setting
a permanent environment variable, see the final section in the
API Token Tutorial.
Download Data
Let's imagine we're attempting to predict ecosystem carbon fluxes based on plant community composition and meteorology. We'll need to download three data products: Bundled eddy covariance (DP4.00200.001), Plant presence and percent cover (DP1.10058.001), and Single-aspirated air temperature (DP1.00002.001).
For simplicity, let's assume we're interested in only 3 sites, spanning a large latitudinal gradient: Toolik Lake (TOOL), Wind River (WREF), and Guanica (GUAN).
Download the data for each data product and site using the neonstore function
neon_download(). We'll download 2019 data for eddy covariance and air
temperature, and 2019-2020 for plant presence.
neon_download(product="DP4.00200.001",
              start_date="2019-01-01",
              end_date="2020-01-01",
              type="basic",
              site=c("TOOL","WREF","GUAN"))

neon_download(product="DP1.00002.001",
              start_date="2019-01-01",
              end_date="2020-01-01",
              type="basic",
              site=c("TOOL","WREF","GUAN"))

neon_download(product="DP1.10058.001",
              start_date="2019-01-01",
              end_date="2021-01-01",
              type="expanded",
              site=c("TOOL","WREF","GUAN"))
Let's take a look at the file structure created for these data. The image below shows there is a folder for each data product, and the eddy covariance folder is opened, showing a sub-folder for each site. The Toolik site folder is open, showing sub-folders for each month of data. The data folder for May 2019 is open, showing the data files.
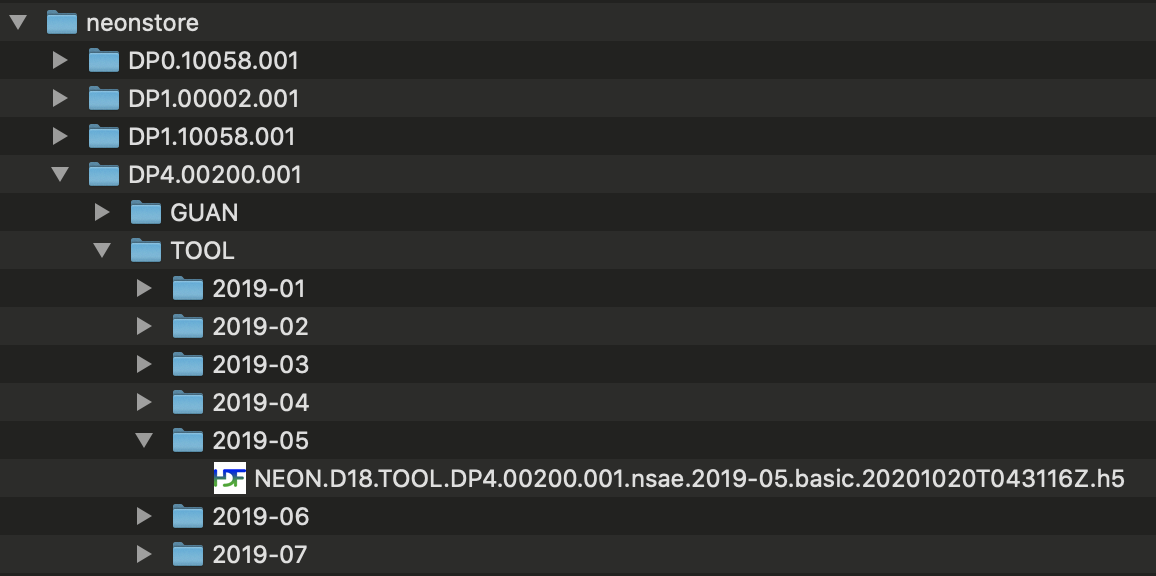
Some data and metadata files are stored at the level of the site sub-folder or the data product sub-folder; these files are not specific to a particular month, and are stored accordingly.
We just downloaded the currently available data, which are the most
recent. Remember that one of our goals here is to retain traceable files
even when data are updated. If you attempt to re-download the same data
immediately, neon_download() will detect that the available files match
the files you already have, and decline to download again:
neon_download(product="DP1.10058.001",
              start_date="2019-01-01",
              end_date="2020-01-01",
              type="expanded",
              site=c("TOOL","WREF","GUAN"))
What would happen if files had been updated between the two downloads? We can't try that out in real time, because files are updated only occasionally, but here is an example folder containing multiple downloads of updated data:
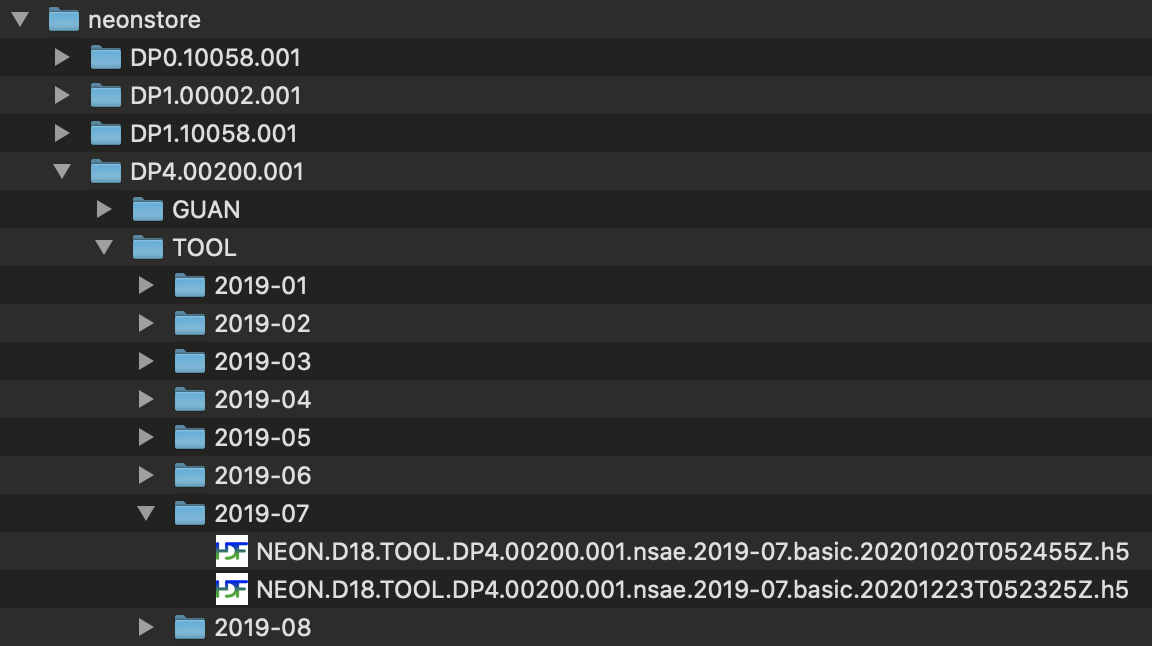
You can see there are two copies of each file. The final 16-character
string in each file name, before the file extension, is a publication
time stamp in the form YYYYMMDDTHHMMSSZ. In this example, the first set of
files were published on October 20, 2020, and the second set on December
23, 2020. neonstore retains both. This allows you to work with the
latest versions of NEON data, without losing traceability to previous
versions.
Extract and Stack Data
To work with the downloaded data, you'll generally want to merge the
site-month tables, or extract variables from the H5 files, in the case of
the eddy covariance data. The stackFromStore() function in neonUtilities
can help you do this.
To learn about the basic stacking functionality in neonUtilities, consult
the Download & Explore tutorial and the Eddy Flux tutorial.
The stackFromStore() function is a wrapper for the stacking functions
described in those tutorials. In this tutorial we'll cover the use
of stackFromStore(), but won't go into background detail about the
stacking functions.
stackFromStore() pulls a subset of data from the neonstore archive, based
on the input criteria, and stacks the data files. Let's get the Toolik and
Wind River temperature, just from March and April 2019:
temp <- stackFromStore(filepaths=neon_dir(),
                       dpID="DP1.00002.001",
                       startdate="2019-03",
                       enddate="2019-04",
                       package="basic",
                       site=c("TOOL","WREF"))
Note that the neonstore directory is an input to the function, to tell it
where to find the data. You can spell out the full file path, or get it
via neonstore using the neon_dir() function.
Important: the basic vs. expanded package specification is repeated here. If you attempt to stack the expanded package from a basic package download, or vice versa, the stacking is likely to go awry. If you need the flexibility to work with either package locally, download both.
Extract Data by Publication Date
As we've discussed, one of the major advantages of neonstore is its
ability to store multiple versions of the same data with different
publication dates. The default behavior in stackFromStore() is to
return the most recently published data, but you can override this
with the pubdate= input.
The pubdate= input will return the most recently published data with
a publication date earlier than pubdate, i.e., the latest date before
the pubdate. In general this should match the data you would have gotten
if you had downloaded the data from the data portal on the date specified
in pubdate. However, in NEON data processing the publication workflow
generates the files and attaches the timestamps, and only after this is
complete for a batch of files, the entire batch refreshes to the data
portal and API. So the publication timestamp is generally slightly
earlier than the date and time when the data became available.
And of course the availability for stacking from neonstore is limited
to the files in your local storage; if a given set of files were
re-published multiple times in between your downloads, you'll only have
the versions you downloaded.
Let's get the Plant presence and percent cover data with a publication date no later than Jan 1, 2021. Start date, end date, and sites are unspecified to include all available.
pppc <- stackFromStore(filepaths=neon_dir(),
                       dpID="DP1.10058.001",
                       pubdate="2021-01-01",
                       package="expanded")
You may encounter a warning message that the div_morphospecies table is
not included in this dataset. That is fine in this case. The stacking code
attempts to find every table described in the variables file. Tables may
be missing for valid reasons, such as protocols with components that are
not carried out every year. But missing tables can also be a sign
of an error in function inputs, such as attempting to stack the expanded
package after downloading the basic package. Check your function inputs
if you see this message, and consult the Data Product User Guide for
information about which data are expected to be available under what
conditions.
And now check which data were included based on a publication date of 2021-01-01:
unique(pppc$div_1m2Data$siteID)

## [1] "GUAN" "WREF" "TOOL"

min(pppc$div_1m2Data$endDate)

## [1] "2019-07-08 GMT"

max(pppc$div_1m2Data$endDate)

## [1] "2019-10-23 GMT"
All three sites are included, but only the 2019 data. The 2020 data hadn't been published yet on Jan 1, 2021.
Stack Surface-Atmosphere Exchange Data
The inputs shown above for stacking observational and
meteorological data can be used for surface-atmosphere exchange data
as well. In this case, stackFromStore() is passing the data files
to stackEddy() instead of stackByTable(), so we need to include
the additional inputs required by stackEddy().
Let's extract and stack the Level 4 flux data from Wind River, April
and May 2019. For more details about stackEddy() options, see the
Flux Data tutorial.
flux <- stackFromStore(filepaths=neon_dir(),
                       dpID="DP4.00200.001",
                       site="WREF",
                       startdate="2019-04",
                       enddate="2019-05",
                       package="basic",
                       level="dp04")
Final Notes and Suggestions
The workflow outlined above is a simple approach to downloading
and stacking NEON data while retaining a reproducible file history.
Keep in mind that using this workflow, we did not save the stacked
data. In repeat analyses, the data would be stacked each time from
the neonstore files. For large datasets, this could be quite
time-consuming and annoying. In those cases, the stacked data could
be written to file and accessed using the readTableNEON() function
(see neonUtilities tutorial).
Alternatively, the stacked files could be stored in a small local
database. The neonstore package includes an option for this, not
covered in this tutorial, or you can implement a similar solution
with your own code.