Research Highlight
Mapping Patterns of Biodiversity
January 9, 2020
Each NEON field site—and sometimes each plot within each site—has its own unique combination of plant, animal and microbial species. Species traits, such as average body length or mass, also vary across geographic regions. But what drives these differences?
Dr. Phoebe Zarnetske, an Assistant Professor in the Department of Integrative Biology at Michigan State University (MSU), is using data from the NEON sites to investigate patterns in biodiversity and species traits across the continent. Her goal is to better understand the drivers that influence species distributions and community assembly.
The project was funded through a National Science Foundation (NSF) grant. The EAGER-NEON program funds research that uses data from the NEON project.
Looking at Drivers of Community Assembly
Integrative biology is an approach to biology that studies biological phenomena at all levels of hierarchy of life, across taxa and across ecological and evolutionary contexts. It brings together many biological disciplines to understand how biological systems develop, function, interact and evolve in a complex and changing world. One of these questions is how communities of species are formed.
Community assembly refers to the processes that influence the mix of species that are present in a given environment and their abundance. This includes both internal processes (such as interactions between species in the community) and large-scale external process (such as climate change or land use patterns).
Phoebe and her team are using data from the NEON project and NASA satellites to identify which drivers seem to be most important in explaining differences in communities across geographic space or changes in communities over time.
A GIS-Based Approach to Integrative Biology
Their approach leverages spatial tools and GIS to visualize patterns in species traits and distribution across geographic space. GIS stands for geographic information system. These computerized modeling tools enable researchers to build sophisticated 2D or 3D maps that layer a variety of data types over geographic maps.
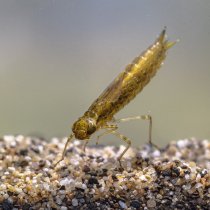
Phoebe's team used spatial tools to map NEON data, starting with small mammal data. The tools allow them to map where species are found across geographic space. They can also map variations in species traits, such as body mass. The next step is layering on other types of data, such as temperature, precipitation, vegetation type and structure, or the presence of other species.
Layering the data together this way in map form allows researchers to see patterns in the data and also quantify their spatial relationships. For example, if a species trait such as body size varies by geographic region, researchers can start looking for correlations with other variables in the data that might suggest a relationship. Are the differences related to seasonal temperature or precipitation patterns? Geologic or topographic variables, such as elevation, soil type or topographic diversity? The presence or absence of other plant or animal species?
In the first study with NEON organismal data, published in Ecography in 2018, the team found that in colder, harsher habitats, the body sizes of small mammal species are very similar, reflecting less competition for resources. Conversely, in warmer environments, the body sizes are more distinct and collectively span a larger range of sizes, reflecting more specialization by species into habitat niches. These relationships help explain why there are more species in warmer environments and fewer species in colder environments.
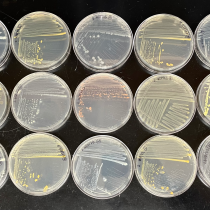
NEON data works well with mapping spatial biodiversity data because it is already geo-tagged and is gathered in exactly the same way at each of the NEON field sites. The NEON project collects a wide variety of data products from each terrestrial or aquatic field site, including meteorological data, vegetation structure and composition, soil or water chemistry, and species abundance and trait data. Kate Thibault, the Lead Research Scientist for the NEON Small Mammal and Avian Ecology program, collaborated on the study and assisted with identification of NEON data products to use in the analysis.
Other co-investigators include Sydne Record (Bryn Mawr College), Angela Strecker (Western Washington University), Benjamin Baiser (U Florida), Lydia Beaudrot (Rice University), Jonathan Belmaker (Tel Aviv University), and Mao-Ning Tuanmu (Academia Sinica). Quentin Read and John Grady were Post-Doctoral Fellows on the project and were instrumental in developing methods to analyze and interpret NEON data. In addition, several REU students helped gather land use history data from co-located LTER and NEON sites.
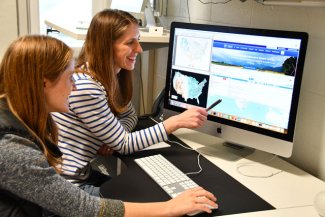
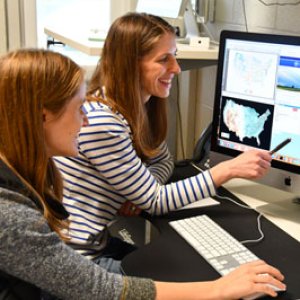
Annie Smith and Phoebe Zarnetske
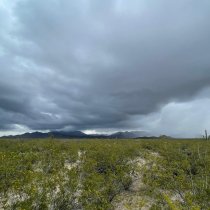
Phoebe and her colleagues are now advancing this work through a 5-year grant from NSF Macrosystem Biology Program. The project aims to identify the scales at which certain drivers affect trait variation and biodiversity in small mammals, fish and ground beetles across the United States. The team is quantifying land use history, geodiversity and disturbance history across the United States with remote sensing data from NASA satellites, which provide information about the geology, vegetation coverage and topography of the landscape. Satellite data can also be used to detect disturbances across large geographic areas and provide clues about past natural disturbances. To detect and attribute these disturbances, Annie Smith, a Post-Doctoral Fellow at MSU, has been developing a data analysis package for R, a software program widely used in the research community.
Scaling from Plot-Level to Continental-Level
One of the questions that Phoebe's research explores is the question of geographic scale. In other words, do the same drivers that act across very large regional or continental scales act at finer scales, within niche habitats at the local level? For example, climate may be a major driver of species traits and abundance at the domain or continental scale, while land use patterns and disturbance history may work more locally.
Data from the NEON project is ideal for answering these kinds of questions. "The design of NEON allows us to investigate different scales of data, from individual plots or stream reaches within a site, to an entire site, to the watershed or ecoclimate domain level, or even across the entire continent," Phoebe explains. "That nested design allows us to understand patterns of diversity and what is influencing these patterns, from a very local level to the continental level."
During the next phase of research, the team will be mapping NEON data against fine-scale satellite data to look at how variability in the landscape impacts biodiversity. Phoebe says, "You would expect that areas that have higher geodiversity would also foster greater biodiversity. We will be testing this and also looking at the scales at which this actually happens."
Science on a Sphere: Bringing Geo-Based Ecology to the People
Phoebe and her co-investigators have been heavily involved in outreach programs to bring greater awareness to the work of large networked observatories like the NEON project and the Long-Term Ecological Research Network (LTER).
One outreach program she is especially excited about is "Science on a Sphere®." The NOAA project uses a room-size interactive display system to display data on a virtual globe. It can be used to visualize and explore a range of earth science and ecology concepts such as climate change, storm formation or complex environmental processes. Phoebe's team is developing a Science on a Sphere module to help visitors understand the drivers of biodiversity and the importance of ecological observation networks. Science on a Sphere can be found in science museums around the world.
She says, "We want the public to understand not only the ecology but also how science works today. Most people still have this perception of scientists as individuals working in a lab. But science at this scale requires the collaboration of many people. These networks provide a framework for this kind of science to happen, as well as opportunities for citizen scientists to get involved."