Is the Future of Ecology Open Source? At NEON, the Answer is Yes.
April 9, 2020
The NEON program generates ecological data on an unprecedented scale. Making sense of that data often requires sophisticated analytical techniques and computer programs. But if you’re not a coder, don’t worry—open source coding resources and community-made custom programs make NEON data more accessible to the ecology community. These resources are now being compiled in the NEON Code Resources Library.
Programming Tools for Data-Driven Ecology
The NEON program generates more than 175 unique data products from 81 aquatic and terrestrial field sites, including data from in situ automated instrument measurements, observational sampling and airborne remote sensing surveys. All the data are freely available to the research community and the public on the NEON Data Portal. This large-scale, coordinated data collection enables a data-driven approach to ecology research.
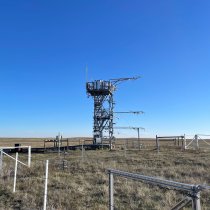
Many of these data products—such as hyperspectral and lidar data from the NEON Airborne Observation Platforms (AOP) and instrument data from the NEON flux towers—generate huge data files. Working with these files and turning them into information that can be used to explore a specific question usually requires a certain amount of reformatting and analysis. Researchers may also want to be able to compare or visualize NEON data products in different ways.
This kind of data processing is done using computer programs or code snippets that range from the simple to the highly sophisticated. Most of this coding has been done in R or Python, though sometimes other programs such as Java or Fortran are used. These custom programs help bring ecological data to life.
An Open Source Resource for Hyperspectral Data
One example was submitted by Dr. Max Joseph, a Data Scientist at the University of Colorado – Boulder’s Earth Lab. He and his colleagues developed an R package called neonhs. The program makes it easier to extract hyperspectral data from the NEON AOP and link them to specific point locations on the ground. Max’s group at Earth Lab is using it to link AOP data with tree species data collected in the field.
A hyperspectral imaging spectrometer collects massive amounts of data. While a regular camera collects data from three spectral bands (red, green and blue), the NEON spectrometer collects data across more than 400 spectral bands, many of them invisible to the human eye. Hyperspectral data can be used to identify materials on the ground using remote sensing or extrapolate information about vegetation composition, chemistry and productivity. For example, photosynthetic activity can be estimated by looking for a specific spectral signature.
Max says, “This is a very cool dataset, but using these data requires technical knowledge that ecologists might not have.” Hyperspectral data can be thought of as a cube, with the X- and Y-axes representing locations on the ground and the Z-axis formed of the 400+ layers of spectral data. Scientists may need to pull out specific spectra for different kinds of analysis. The NEON spectrometer produces spectral data down to a resolution of 1 m2, creating enormous amounts of data with every flight.
Max’s work builds on an earlier R package called neonaop, created by Leah Wasser. Leah was a NEON program employee when she created neonaop and now works with Max at Earth Lab. The neonhs package adds testing tools and documentation to make it even easier for ecologists to efficiently extract spectral data at spatial point locations.
Researchers could use the data package to analyze the spectra associated with trees that have already been identified through field research. This will allow them to discover the “spectral fingerprints” associated with each species. Eventually, this could lead to improved accuracy in identifying tree species using remote sensing data alone. Spectral data extracted through neonhs could also be used for a range of other research projects where spatial point locations are needed.
The neonhs package is now discoverable in the NEON Code Resources Library and available on GitHub, an online repository for code and similar resources. As part of his work at Earth Lab, Max has developed a number of other R packages for the ecology community, including the smapr R package for NASA soil moisture data.
“The volume and diversity of data available to ecologists through NEON is incredible,” says Max. “This creates lots of opportunities but also serious technical challenges, what we at Earth Lab call ‘data pain.’ Our goal is to lower the barriers to entry for beginners and help experts automate their data workflows so they’re not always reinventing the wheel.”
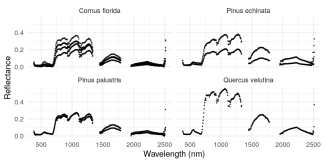
Image of spectra for four different species of plants observed at NEON sites, extracted with the neonhs package.
Bringing Open Source Tools to the Ecology Community
Open source coding tools are likely to play a growing role in ecology as more scientists begin to explore the potential of large-scale networked science. Dr. Claire Lunch, a Data Scientist for the NEON program, says, “The NEON program makes an incredibly broad range of data publicly available. We want to help people find and use these resources. We have created tools that do many of the more common things people want to do with our data, but we can’t anticipate all of the diverse ways people may want to manipulate and use these data. That’s where the wider community comes in.”
The NEON Code Resources Library collects both NEON-created and community-created tools for NEON data processing, visualization and analysis. The NEON program has created tools focused on the mechanics of working with certain data sets and common reformatting required for analysis. These include the neonUtilities package for download and reformatting of most NEON data types; the eddy4R package, which is used to process NEON flux tower data and generate the NEON surface-atmosphere exchange data products; and the stageQCurve package, which creates a continuous discharge record from water level data. Community-created code includes tools for analysis of a number of different NEON datasets, including phenocam, meteorological, geolocation and remote sensing data.
All of these tools are open source. This allows the research coding community to build on and improve each other’s work, leading to more and better tools over time. The NEON Code Resources Library acts as a central repository for ecologists and data scientists working with NEON data. Claire says, “We want to facilitate people sharing the code they have written. Often, if one group is developing code to do something specific, that code will be useful for many other groups as well. NEON data users can now come here to see if anyone else has already developed code for the task they are trying to accomplish. When code is shared like this in an open source format, it only makes the code better, and that makes the science better.”
Max says, “Not every scientist can or should invest time in becoming an expert in everything. Software development is an area that can be a barrier for many researchers. By building and supporting open source tools, the community of NEON data users can grow faster and broader. These tools automate some of the more labor-intensive parts of working with data to shorten the path from data to discovery.”
How to Submit Code to the NEON Code Resources Library
The NEON Code Resources Library welcomes open source code contributions from individual researchers and groups. All code must be made available as an open source resource and be related to one or more NEON data products.
There are three levels of vetting for code available through the NEON Code Resources Library.
- Tier 1 (Community Contributed Code) is reviewed to ensure that it is publicly available, generally comprehensible, and involves NEON data. Code functionality is not evaluated.
- Tier 2 (NEON Certified Code) goes through additional code review to ensure that it performs as described and without error.
- Tier 3 (NEON Production Code) is code that is developed by the NEON program and used to generate NEON data products. It has undergone extensive review and testing.
Programming languages currently accepted include R, Python, Java, Fortran and MATLAB, with code in other programming languages also being acceptable. Those wanting to submit code should read the full Code Resource Guidelines before submitting. Code is submitted through the Code Resources Submission web form.
The ultimate vision is for the library to become a “one-stop-shop” for researchers looking for tools to help manipulate, analyze and visualize NEON data products. Claire says, “We provide open data for anyone who wants to use them for any purpose, but that open data environment will not be a success unless people actually take advantage of it. It can be really challenging to start at square one in this giant world of data. Making it more accessible means giving people tools to get what they need out of the data and connecting them to a community of data users who can help them. These open source tools multiply the impact of the NEON data and the number of people who can use the data successfully.”