Meteorology
Weather and changing conditions along with seasonally changing biological and biogeochemical processes are important drivers and indicators of terrestrial and aquatic ecosystem function. Meteorological measurements across the world provide valuable data that our weather and flood forecasts depend on.
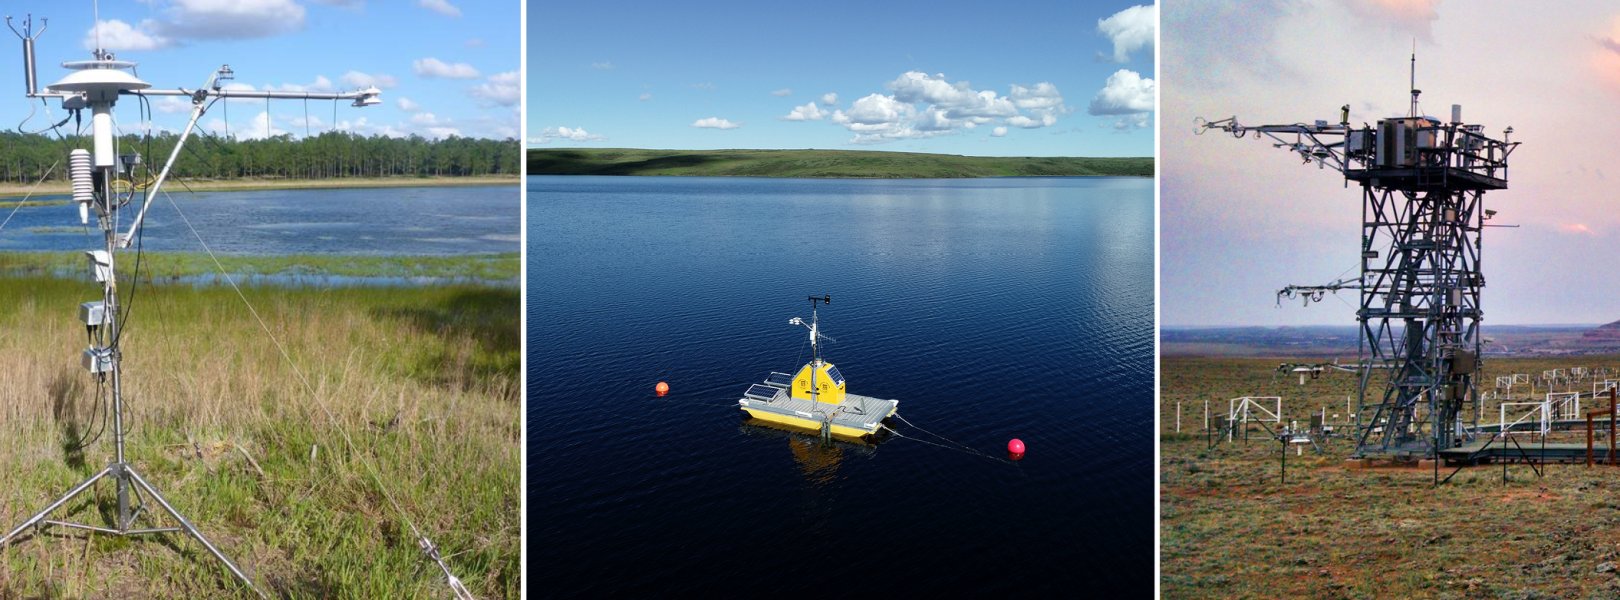
NEON monitors weather and conditions using various meteorological instruments deployed across terrestrial and aquatic sites. Continuous measurements capture patterns and cycles across various time periods, ranging from seconds to years. Changing weather and eco-system measurements include air temperature, humidity, precipitation, wind speed and direction, barometric pressure, and radiation. Additionally, terrestrial sites monitor phenological trends, soil heat flux, and precipitation stable isotopes, as well as atmospheric flux and isotope measurements for carbon dioxide (CO2) and water vapor (H2O) at flux towers. Meteorological infrastructure generally varies between aquatic and terrestrial sites, but often share the same sensors and data products.
Heat, water vapor, carbon dioxide, and other gases are continually exchanged between the Earth’s surface and the atmosphere. Soil, vegetation, and other living things on the Earth absorb energy from the sun and take in gases and water from the atmosphere, directly or through precipitation. They also radiate heat, send water back into the atmosphere through evapotranspiration, and release carbon and other gases back into the air through respiration. In a very real way, we can think of these fluxes as the planet breathing. To monitor this exchange at the boundary layer between living and nonliving things on the Earth and the atmosphere above, NEON collects eddy-covariance (EC) flux data alongside meteorological and atmospheric composition data at each terrestrial field site.
EC data are collected using sensors that measure temperature, moisture and gas concentrations within the turbulent air currents that move past a flux tower. By combining these data with information about the speed and direction of the air currents themselves, we can get a picture of how energy, water and gases are flowing into and out of the atmospheric boundary layer. There are also other networks collecting comparable flux data in the U.S. and internationally, including AmeriFlux, FLUXNET, ICOS and TERN. NEON represents the largest single-provider EC tower network globally, and greatly expands the number of geographic areas and types of ecosystems where these data are being collected.
Through a quantitative, footprint-based framework of mutual representativeness and exclusion, flux tower measurements are collocated with NEON’s terrestrial observation system, airborne observation platform, aquatic instrument system, and aquatic observation system (Metzger et al., 2019). This allows direct integration with and extrapolation between these types of measurements. For example, meteorological measurements combined with NEON’s soil, plant and organismal data support the ecosystem-level study of carbon dioxide, water vapor and energy fluxes, as they cycle through the atmosphere, vegetation, and the soil. Flux tower data combined with soil and airborne remote sensing data supports scaling of fluxes, soil moisture, and evapotranspiration to a continental scale. Data collected from the tower support greater understanding of ecological processes and change, such as changes in air quality and climate.
NEON terrestrial site design with the instrument and observing systems covering a wide range of scales. The terrestrial instrument system comprises a flux tower, multiple soil plots (white squares), as well as a rain gauge (DFIR, or Double Fence Intercomparison Reference). Basic meteorological, atmospheric composition, and eddy covariance (EC) flux instrumentation are located on the tower top. These capture the larger-scale synoptic forcing and surface-atmosphere exchange of the surrounding ecosystem, respectively. Additional measurements at multiple vertical levels along the tower, at the rain gauge and in the soil capture local phenomena.

Guanica Forest (GUAN): A Double Fence Intercomparison Reference (DFIR) collects precipitation data in a clearing at many terrestrial field sites.
Data are collected using a series of automated sensors installed on a walk-up tower. This flux tower is placed in the dominant vegetation at the field site and positioned to maximize data capture along the predominant wind direction in order to measure the representative ecosystem. The flux tower extends past the top of the vegetation canopy at each site to allow sensors mounted at the top and along the tower to capture a full vertical profile of atmospheric conditions from the top of the vegetation canopy to the ground. The number of measurement levels on a tower vary from four to eight levels depending on the ecosystem structure at each site. Horizontal poles, or boom arms, extend outward from the tower at each level. Each boom arm is 4 m long, which is twice the width of the tower to minimize the impact of flow distortion caused by the tower on wind measurements.
Each NEON flux tower comprises multiple instrument assemblies, including the EC turbulent exchange assembly, the EC storage exchange assembly, the meteorology assembly, and the atmospheric composition assembly (see Metzger et al., 2019 for additional information).
Instrument Assemblies
Meteorology
The meteorology assembly measures baseline meteorological variables at frequencies between 0.1 and 1.0 Hz. These include incoming/outgoing shortwave and longwave radiation, in addition to air temperature, relative humidity, dewpoint temperature, two-dimensional wind speed and direction vertical profiles, barometric pressure, and precipitation. Further variables such as direct and diffuse radiation, throughfall precipitation, biological temperature, and photosynthetically active radiation vertical profile are also measured, and phenology imagery is taken.
Turbulent exchange
The eddy-covariance (EC) turbulent exchange assembly aims to maximize data coverage and quality through close integration of a suite of sensors and auxiliary components. The three-dimensional wind components at the tower top are measured by a sonic anemometer operating at a rate of 20 Hz. An attitude and heading reference system is attached to the sonic anemometer and includes a gyroscope, accelerometer, and magnetometer that collect data at a rate of 40 Hz. This allows rotated deployment of the sonic anemometer following the streamlines at sloped sites and makes it possible to quantify and correct residual boom and tower motions. The H2O and CO2 concentrations are measured at 20 Hz by an enclosed-path infrared gas analyzer in combination with a mass flow controller that ensures a flow rate of 12 standard liters per minute through the sampling cell (Metzger et al., 2016). Last, a validation system supplies reference gas concentrations to the infrared gas analyzer every 23.5 hours for periodic validation to quantify and correct sensor drift.
Storage exchange
The EC storage exchange assembly consists of a suite of sensors that record air temperature and CO2 and H2O concentration vertical profiles for the calculation of corresponding storage fluxes (Xu et al., 2019). Air temperature is measured at a rate of 1 Hz using triple-redundant aspirated platinum resistance thermometers at the tower top, and single aspirated platinum resistance thermometers at the remaining vertical profile levels. To measure CO2 and H2O concentrations at a rate of 1 Hz, an infrared gas analyzer is located in the instrument hut. During sampling mode, the infrared gas analyzer cycles through air samples that are drawn from each vertical profile level on the tower. The site-specific flow rate of 5–11 standard liters per minute is controlled to maintain the sample line pressure at 40%–50% of the ambient pressure to prevent condensation. During the field validation mode, reference gas concentrations are supplied to the infrared gas analyzer, similar to the EC turbulent exchange assembly.
Atmospheric composition
The atmospheric composition assembly comprises a suite of sensors that further characterize wet deposition, atmospheric isotopes, and particulate matter. Gaseous-phase stable carbon and water isotopes are measured along the flux tower vertical profile of all terrestrial sites. Wet deposition including stable isotope sampling occurs at the flux tower top across 37 terrestrial sites, which were selected to represent a range of concentrations of nitrate, ammonium, and sulfate. Particulate matter less than or equal to 10 µm in the atmosphere are monitored via PM10 sampling and continuous particle size monitoring at a transect across the Rocky Mountains consisting of six sites. Aerosol optical depth measurements at the tower top complete the atmospheric composition assembly.
Soil
The soil assembly includes five soil plots containing a suite of meteorological sensors including photosynthetically active radiation, net radiation, infrared biological temperature, relative humidity and throughfall precipitation. The plots are typically arranged along a transect within the zone of mutual representativeness (see “Flux Tower” section below) in the locally dominant (~1-km2 scale) soil type. Spacing between soil plots was determined by assessing spatial variation in soil temperature and moisture over 1 ha (Loescher et al. 2014) to maximize spatial independence, while being limited to ≤40 m spatial separation because of cost constraints. Vertical profiles of soil temperature (nine or fewer sensors per plot), moisture (eight or fewer sensors per plot), and CO2 concentration (three sensors per plot) are measured in each plot, with measurement depths based on absolute soil depth, soil horizon thicknesses, and other soil properties. Soil heat flux is measured 8 cm below the soil surface in three of the soil plots. All soil sensor measurements are made at 0.1 Hz. Additional information on soil measurements is available on the Soil Sensors webpage.
Sensor-specific details can be found in the data product documentation on the NEON data portal.
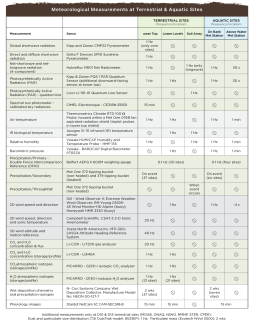
NEON Meteorological Measurements table 2021