NSF NEON, Operated by Battelle

Main navigation

  • About Us
    • Overview
      • Spatial and Temporal Design
      • History
    • Vision and Management
    • Advisory Groups
      • Science, Technology & Education Advisory Committee
      • Technical Working Groups (TWGs)
    • FAQ
    • Contact Us
      • Contact NEON Biorepository
      • Field Offices
    • User Accounts
    • Staff
    • Code of Conduct

    About Us

  • Data & Samples
    • Data Portal
      • Explore Data Products
      • Data Availability Charts
      • Spatial Data & Maps
      • Document Library
      • API & GraphQL
      • Prototype Data
      • External Lab Data Ingest (restricted)
    • Data Themes
      • Biogeochemistry
      • Ecohydrology
      • Land Cover and Processes
      • Organisms, Populations, and Communities
    • Samples & Specimens
      • Discover and Use NEON Samples
        • Sample Types
        • Sample Repositories
        • Sample Explorer
        • Megapit and Distributed Initial Characterization Soil Archives
      • Sample Processing
      • Sample Quality
      • Taxonomic Lists
    • Collection Methods
      • Protocols & Standardized Methods
      • Airborne Remote Sensing
        • Flight Box Design
        • Flight Schedules and Coverage
        • Daily Flight Reports
          • AOP Flight Report Sign Up
        • Camera
        • Imaging Spectrometer
        • Lidar
      • Automated Instruments
        • Site Level Sampling Design
        • Sensor Collection Frequency
        • Instrumented Collection Types
          • Meteorology
          • Phenocams
          • Soil Sensors
          • Ground Water
          • Surface Water
      • Observational Sampling
        • Site Level Sampling Design
        • Sampling Schedules
        • Observation Types
          • Aquatic Organisms
            • Aquatic Microbes
            • Fish
            • Macroinvertebrates & Zooplankton
            • Periphyton, Phytoplankton, and Aquatic Plants
          • Terrestrial Organisms
            • Birds
            • Ground Beetles
            • Mosquitoes
            • Small Mammals
            • Soil Microbes
            • Terrestrial Plants
            • Ticks
          • Hydrology & Geomorphology
            • Discharge
            • Geomorphology
          • Biogeochemistry
          • DNA Sequences
          • Pathogens
          • Sediments
          • Soils
            • Soil Descriptions
        • Optimizing the Observational Sampling Designs
    • Data Notifications
    • Data Guidelines and Policies
      • Acknowledging and Citing NEON
      • Publishing Research Outputs
      • Usage Policies
    • Data Management
      • Data Availability
      • Data Formats and Conventions
      • Data Processing
      • Data Quality
      • Data Product Bundles
      • Data Product Revisions and Releases
        • Release 2021
        • Release 2022
        • Release 2023
        • Release 2024
        • Release-2025
      • NEON and Google
      • Externally Hosted Data

    Data & Samples

  • Field Sites
    • About Field Sites and Domains
    • Explore Field Sites
    • Site Management Data Product

    Field Sites

  • Impact
    • Observatory Blog
    • Case Studies
    • Papers & Publications
    • Newsroom
      • NEON in the News
      • Newsletter Archive
      • Newsletter Sign Up

    Impact

  • Resources
    • Getting Started with NEON Data & Resources
    • Documents and Communication Resources
      • Papers & Publications
      • Document Library
      • Outreach Materials
    • Code Hub
      • Code Resources Guidelines
      • Code Resources Submission
      • NEON's GitHub Organization Homepage
    • Learning Hub
      • Science Videos
      • Tutorials
      • Workshops & Courses
      • Teaching Modules
    • Research Support Services
      • Field Site Coordination
      • Letters of Support
      • Mobile Deployment Platforms
      • Permits and Permissions
      • AOP Flight Campaigns
      • Research Support FAQs
      • Research Support Projects
    • Funding Opportunities

    Resources

  • Get Involved
    • Advisory Groups
      • Science, Technology & Education Advisory Committee
      • Technical Working Groups
    • Upcoming Events
    • NEON Ambassador Program
      • Exploring NEON-Derived Data Products Workshop Series
    • Research and Collaborations
      • Environmental Data Science Innovation and Inclusion Lab
      • Collaboration with DOE BER User Facilities and Programs
      • EFI-NEON Ecological Forecasting Challenge
      • NEON Great Lakes User Group
      • NEON Science Summit
      • NCAR-NEON-Community Collaborations
        • NCAR-NEON Community Steering Committee
    • Community Engagement
      • How Community Feedback Impacts NEON Operations
    • Science Seminars and Data Skills Webinars
      • Past Years
    • Work Opportunities
      • Careers
      • Seasonal Fieldwork
      • Internships
        • Intern Alumni
    • Partners

    Get Involved

  • My Account
  • Search

Search

Impact

  • Observatory Blog
  • Case Studies
  • Papers & Publications
  • Newsroom

Breadcrumb

  1. Impact
  2. Observatory Blog
  3. Windows into unseen waters

Windows into unseen waters

April 24, 2012

By Michael Fitzgerald

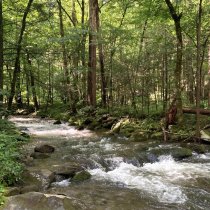
For most people, water is just something that comes out of a faucet in their house. We pay little attention to how it gets there. For some of us, though, water and especially groundwater is a continual point of focus. Groundwater moves almost as slowly as paint dries, yet it’s super fascinating to a few of us and important to all of us. Water is extremely important to life on this planet. Finding freshwater is a challenge to many of the inhabitants on earth, particularly in poorer regions. Even though the surface of the earth is roughly 70 percent covered by water, the vast majority of this water is salty ocean water. Freshwater amounts to just three percent of the Earth’s total water, and about a third of freshwater is groundwater. Groundwater is an important part of our tiny usable water supply, and we need to monitor it.
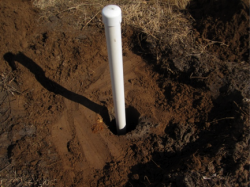
Well in ground soil

Well in ground soil

I am a hydrologist here at NEON, which means I work with surface water (like that in lakes and streams) and groundwater.

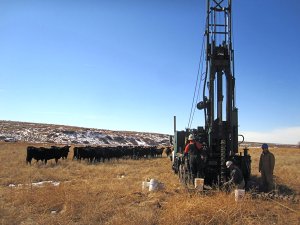
My background is in hydrogeology, which means I focus on the water that we can’t easily observe: the water that’s held within the soils and rocks below our feet. We can’t observe it directly, so to study it, we put fancy straws into the ground. In mid-February, while many other people were wooing their significant others for Valentine’s Day, we were hard at work establishing the first portion of NEON’s groundwater observation well network. The first wells are part of the Central Plains region (Domain 10) and are situated around the Arikaree River in eastern Colorado. The site is a pristine grasslands area which has a gentle topography of rolling hills with a small portion of the Ogallala Formation present along the southern boundary. NEON collaborated with the U.S. Geological Survey to install the wells at the site. Initial characterization of the site, performed by the USGS, used a combined geophysics approach to attempt to define the anticipated depth that we would need to drill the wells. In other words, we used electricity to look for water. For those of you who haven’t used electrical resistivity (a geophysics method) to study aquifers before, here’s how it works: We apply a small amount of electrical current to the soil though a pair of electrodes and measure the resulting electric potential at a separate set of electrodes. Several electrodes are positioned in a line and the current and electrode pairs are automatically swapped around many times through all the electrodes. If you do this enough, swapping the current pair of electrodes and potential pair, what you get are a set of measurements that yield a map of the soil’s ability to conduct electricity.

We use a fancy numerical modeling technique called an “inversion” which takes the raw data that we collect from the electrodes and computes what the subsurface architecture must look like to yield the electrical signals we collected. The reason this works so well is that water conducts electricity and we can “image” underground soils and soil moisture this using this technique. More accurately, we can use this technique to look for differences in the electrical conductance of the soil layers and make inferences as to where there is water or at least a shift in the underlying layers. We also make some eye-catching images.

The water table, or the minimum distance between the ground surface and available groundwater, fluctuates due to seasonal variations of input (i.e. rain and snow melt) and extraction (i.e. irrigation and drinking water). The wellxs were constructed to allow for the full range of seasonal oscillation in the groundwater table to be observed. During the drilling operations we observed the water table at about 5 feet below the ground surface and anticipated that the water table could lower by up to 15 feet below current level if irrigation increased and rain and snow pack in the mountains decreased over the next few decades. Historic information on the groundwater level fluctuations around the stream was not available before we installed the wells. So we opted to use a slotted pipe 15 feet in length and positioned from 10 to 25 feet below ground surface to allow for substantial fluctuations in the water table and still have the well intersect it.

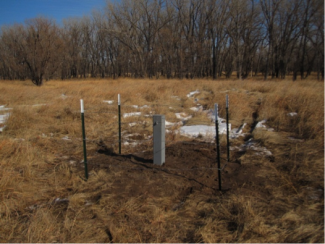
And finally, we have NEON’s first groundwater observation well. In the coming months the NEON aquatic team will be installing sensors in the wells and in the stream to begin prototyping activities of the sensors and their data streams. Once we install water level sensors in the wells we’ll be able to track the oscillation of the groundwater table and will begin to establish the historical groundwater record in this region. The data collected through this network will establish a database that will allow local farmers to track the generalized effects of irrigation on groundwater levels in the region. This data will also be useful to the greater scientific research community as a part of the puzzle piece for examining continental scale ecological drivers and responses, among many other potential studies. Stay tuned for more developments!

Share

Related Posts:

A Chance for Fire Research and Recovery at a NEON Desert Site

January 24, 2025

Burned cactus

Discontinuing SF6 releases as part of Reaeration (DP1.20190.001) at all NEON sites

April 15, 2025

2025 Data Release: Zooplankton collection count data recalculated for discrete time periods

March 18, 2025

NSF NEON, Operated by Battelle

Follow Us:

Join Our Newsletter

Get updates on events, opportunities, and how NEON is being used today.

Subscribe Now

Footer

  • About Us
  • Newsroom
  • Contact Us
  • Terms & Conditions
  • Careers
  • Code of Conduct

Copyright © Battelle, 2025

The National Ecological Observatory Network is a major facility fully funded by the U.S. National Science Foundation.

Any opinions, findings and conclusions or recommendations expressed in this material do not necessarily reflect the views of the U.S. National Science Foundation.