Research Highlight
Where Does the Water Go? Partitioning Evaporation and Transpiration
November 5, 2020
How much of the water that enters terrestrial systems is used by plants for growth, and how much simply escapes back into the atmosphere unused? Chris Adkison, a researcher at Texas A&M University, used data from the NEON program to compare the accuracy of different methods of partitioning evaporation and transpiration in a Texas oak woodland. He and his coauthors recently published their findings in Water. Their work may lead to better predictive models of evapotranspiration (ET) in terrestrial systems and a better understanding of the water cycle.
Evaporation + Transpiration = Evapotranspiration
What is evapotranspiration? ET is the combination of two natural processes that return water from earth systems to the atmosphere.
- Evaporation happens when energy from the sun heats up water on the surface of oceans, lakes and streams, in the soil, or on natural or manmade surfaces, causing liquid water to turn back into water vapor.
- Transpiration is the process of plants absorbing water from their roots and releasing it from small pores (stomata) in leaves, stems, and flowers.
Evapotranspiration is a critical part of the water cycle. Water is continually moving between the atmosphere and earth systems, coming down from the atmosphere as precipitation and returning through ET. Along with the carbon cycle and energy cycle, the water cycle is one of the major biogeochemical fluxes that makes life on Earth possible.
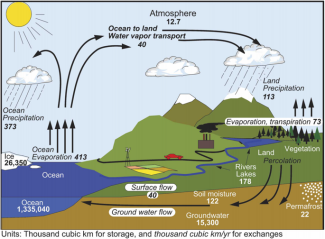
The water cycle. Image credit: Trenberth et al. 2007.
Evapotranspiration is the largest terrestrial flux of water; about 65% of water in terrestrial systems moves through the water cycle through ET. In arid environments, evapotranspiration may account for as much as 95% of the water in terrestrial systems. However, it has been relatively understudied in comparison with surface water and groundwater.
Chris’s research focuses on separating out, or partitioning, the evaporation and transpiration portions of the ET equation. This will give ecologists more insight into how much water in a terrestrial environment is used for what we consider productive purposes (growing crops, trees, and other plants) and how much simply escapes back into the atmosphere without first being used for biological processes. ET partitioning studies are an important part of the science of ecohydrology – the interactions between water and ecological systems.
Partitioning Evapotranspiration in a Texas Oak Woodland
Chris and his coauthors wanted to compare different methods of partitioning evapotranspiration. They chose an oak woodland site within the Lyndon B. Johnson (LBJ) National Grasslands in Wise County, Texas. CLBJ is a terrestrial site for the NEON program within the Southern Plains Domain (D11).
They chose a NEON site because of the availability of data and instrumentation from the NEON program, including eddy covariance data. The NEON tower at the site has an array of sensors at four levels within the woodland and above the canopy, including a sonic anemometer, net radiometer, open-path CO2/H2O analyzer, and tubing to collect water vapor for isotopic analysis. The eddy covariance towers directly measure the flux of water, carbon, and other gases between the atmosphere and the forest canopy. The NEON program also collects a broad range of other useful data at the site, including meteorological, soil sensor, and observational data.
Chris says, “Having the NEON data was a dream come true. The amount of data they collect, along with the types of instruments they have on site, is something that no grad student or university lab would be able to manage or purchase independently. Having the NEON field staff there to manage instruments and keep data quality really high, over long periods, makes studies like mine possible. NEON does it all and I just get to use the data.”
One of the NEON instruments Chris was most excited about is the Cavity Ring-Down Spectrometer (CRDS). This enables analysis of water vapor collected at different levels in the forest canopy to determine the concentrations of different stable isotopes of water. Different isotopes (atomic variants) of water have different atomic weights, which means some isotopes evaporate more easily than others. Studying the concentrations of different stable isotopes of water at different levels in the canopy can provide insights into evaporation dynamics in the forest. Stable isotope analysis is a relatively new method of partitioning ET.
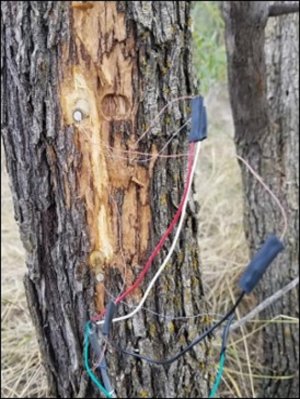
One traditional method of partitioning ET uses eddy covariance data and sap flow meters; thus, Chris and his colleagues added their own sap flow meters to trees in the study area to measure how water moves through the trees. By subtracting the amount of water that moves through the trees from the total amount of water vapor entering the atmosphere from the terrestrial environment (measured by CRDS on the eddy covariance towers), researchers can get an estimate of how much water entering the atmosphere is channeled through plant life (transpiration) and how much is simply evaporating. They also collected twig and soil samples monthly on the days that they completed CRDS analysis. This allowed them to compare concentrations of stable isotopes in water extracted from the twig and soil samples to the concentrations in atmospheric water vapor.

A sap flow meter on a tree in the CLBJ NEON site. Photo credit: Chris Adkison.
Comparing Methods for Partitioning Evapotranspiration
The study is the first to compare traditional ET partitioning methods using eddy covariance and sap-flux with high-resolutions stable isotope methods in a natural oak woodland site. It also may be the longest running study of its kind. Because of the difficulty of collecting the data, most ET studies run for only a short time during the growing season. Chris and his coauthors compared the methods over a nine-month period, including both growing and dormant seasons.
Their study shows that transpiration accounts for about 20-40% of all ET at this site, depending on the season, which was in line with what they expected. However, they discovered that the stable isotope method of partitioning ET did not compare favorably with traditional eddy-covariance and sap flow methods, which rely on direct measurement. Evidence from their research indicates that estimates of ET partitioning using stable isotope analysis may overestimate transpiration by as much as 41-49%. The stable isotope method performed especially poorly during the dormant season.
This is important because that may mean that predictive models built using stable isotope analysis may not be entirely accurate. The researchers concluded that the accuracy of stable isotope ET partitioning methods can be improved by using high-resolution temporal data that combines analysis of twig and soil samples collected simultaneously with the CRDS data.
Building Better Ecohydrology Models
Chris plans to continue to refine his research with additional data collection that captures data from more plant species within the forest. He also would like to see the study repeated for additional ecosystem types.
Chris would like to further explore the use of other data from the NEON automated instrument systems, such as soil moisture and vapor pressure deficit (VPD), that could be used as proxies for water extraction from physical twig and soil samples. This would allow data to be collected at a much higher temporal resolution (in 30-minute increments) across long time periods, without the need to have scientists in the field to collect physical samples. Refining these methods would make it easier and more cost-effective to conduct ET studies for extended time periods across different ecosystems.
Ultimately, Chris hopes this work will lead to better models of ecohydrology within different types of ecosystems, which could have implications for agriculture, forestry, and conservation. A better understanding of how water moves through the ecosystem could help conservationists, farmers, and land managers make better decisions for managing plant communities to maximize the use of available water. Improving models of ET partitioning could also help researchers improve climate change models.
Chris says, “Science is this ever-changing body of knowledge. We looked at methods developed in the 1960s that are still being used relatively unchanged today. With the new technology available now, we believe these methods can be improved upon. Our work shows that there is nothing fixed in science. As we continue to refine our methods, our models can get better and better.”
Read more about this research: “An integrated approach for partitioning daily evapotranspiration in an oak woodland using high-frequency water vapor isotopic measurements.”