Research Highlight
What Can a Hurricane Tell Us About Soil Health Metrics?
August 26, 2020
Soil scientists use a variety of metrics to measure aspects of soil health. For example, they may measure the percentage of soil organic matter (SOM) or look more specifically at available carbon or nutrients. But how well do these metrics hold up under extreme conditions—say, in the aftermath of a hurricane?
Dr. Zachary Kayler, an assistant professor in the Department of Soil and Water Systems at the University of Idaho, recognized an opportunity to test the sensitivity of soil health metrics using soil samples taken before and after Hurricane Maria, the destructive Category 5 hurricane that tore through the Gulf of Mexico in late 2017. He used soil samples from the NEON Archival Samples Catalog to test the ability of a widely-used soil health metric to detect changes from an extreme weather event.
How Soil Health is Measured
Soil is made up of both organic and inorganic elements. Organic material is the part of the soil made up of living or formerly living things, such as microbes, fungi, and decaying plant and animal tissues. Organic matter contains carbon (C) along with other elements necessary for microbes, fungi, and plants to thrive, such as nitrogen (N) and phosphorus (P).
The content of organic material in a soil sample tells us a lot about the health of the soil and the ecosystem as a whole. Soils rich with organic material are able to support more plant and animal life. Soil health metrics are critically important for farmers and agricultural planners as well as ecologists and land managers. Monitoring soil health tells us how soil is responding to agricultural regimens, land management decisions, changes in climate, and natural disturbances.
There are several different metrics used to measure soil health. The simplest is the total amount of carbon-containing material as a percentage of soil weight. Other metrics look more specifically at the bioavailability of carbon or nutrients—that is, whether the elements are in a form that living things can readily use.
Zachary’s study looks specifically at a soil health metric called permanganate oxidizable carbon, or POX-C. POX-C measures the fraction of SOM that is in a form that oxidizes in the presence of potassium permanganate. This is also the form of carbon most readily degradable by soil microorganisms. The POX-C measurement is widely accessible and cost effective for scientists, making it one of the most widely used and accepted methods for measuring the amount of bioavailable carbon in soil. Zachary wanted to find out how sensitive POX-C is to changes in soil composition caused by an extreme weather event, as well as compare it to other soil health indicators.
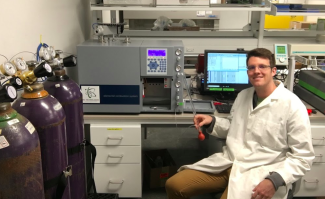
Technician John Hayes preparing a soil sample for the elemental analyzer. Photo credit: Zachary Kaylar.
He says, “Different measurement methods give us different perspectives on soil health. Many of these methods haven’t changed much over the last 100 years. Now, we’re seeing dramatic changes in weather events, climate patterns, and land use pressures. It’s important to understand how our available tests perform under conditions that may be very different than when they were developed, so we know how well indices developed in the past will continue to perform in the future. One way to get a glimpse of that is to see how they perform during an unusual event.”
Putting Soil Health Metrics to the Test
Hurricane Maria, which struck the island of Puerto Rico in September 2017, provided an opportunity for Zachary to do this research. Maria was one of the most devastating storms to ever hit Puerto Rico, directly causing hundreds of deaths and widespread and long-lasting damage to infrastructure, businesses and residences across the island.
Maria also had a big impact on natural ecosystems. The NEON field sites in Puerto Rico sustained significant damage. Data from the Puerto Rico field sites provides a window into ecosystems before and after the hurricane, allowing scientists to see how Maria impacted vegetation structure, community composition, and other measures of ecosystem function, health, and resilience. The Guánica Forest (GUAN) field site is in a dry tropical coastal forest located in Guánica Forest Reserve. Lajas Experimental Station (LAJA) is an agricultural research station used for cattle grazing and crop growing. Data from these sites allow researchers to see how both natural and human-impacted ecosystems respond to natural disturbances.
Zachary used soil samples taken from the GUAN and LAJA sites before and after the hurricane, which are available from the NEON Archival Sample Catalog. His primary interest was in testing the ability of the POX-C soil health metric to provide meaningful information following an extreme event. “We need to know whether soil health metrics are still valid and reliable during abnormal events like droughts or severe storms,” he explains. “Our metrics are generally just tested under normal conditions. If all of the points that we look at are within the mean, we don’t know whether the metric is still giving us good information for conditions outside the mean. Is it still valid? Does it mean anything? Sometimes, we ignore these ‘long-tail’ events, and we shouldn’t.”
Some of Zachary’s previous experiments have involved inducing or simulating extreme conditions such as drought, flooding, or snow insulation. But capturing a real extreme event in nature is much more difficult.
The soil archives from GUAN and LAJA provided a rare opportunity to see how well POX-C captures changes in carbon availability after a hurricane. “We can’t predict exactly when and where a hurricane will hit, so it’s rare to have soil samples available from both before and after a hurricane,” Zachary says. “That’s why long-term monitoring programs like the NEON program are so important. They provide consistent, comparable data over time. When a natural event like this hits, we are able to look at the before and after data to see the effects.”
Finding the Right Metrics to Measure Ecosystem Recovery
The incubations of soil samples collected before and after Hurricane Maria show decreases in carbon and nitrogen availability in both the forested and agricultural sites. While Zachary’s study does not attempt to explore the reasons behind these changes, the results align with his expectations.
He explains, “Disturbances like this cause reorganization for all of the ecosystem players involved, including vegetation and microbes. After an event like this, communities are trying to reestablish themselves. Plants are drawing on carbon reserves during regrowth and microbial communities are being actively drawn into collecting nutrients used by the plants. A lot of the vegetation has been removed, so more leaching can occur during precipitation. A lot more work needs to be done to really understand all of these interactions. It is important to know that soil health metrics, especially incubations, are providing accurate information so that we can get a clearer picture of ecosystem health and recovery after a large disturbance event.”
The study compares POX-C analysis to other measures of soil health and carbon availability, including elemental analysis (which involves combusting soil samples) and incubation (which measures C and N loss to microbial processes during an incubation period). The results show that incubation provides a better measure of the hurricane’s impact on soil health than POX-C or elemental analysis. The POX-C measurements show little change before and after the hurricane. Zachary says, “Soil incubation is really the gold standard, and this study showed that it was the most sensitive to changes due to the disturbance. POX-C was able to reliably detect differences in available carbon between land use types—the forested site vs. the agricultural site—but did not detect changes before and after the hurricane.”

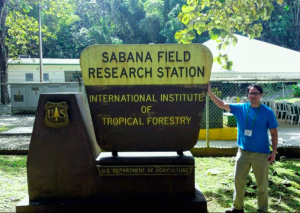
Zachary Kaylar in Puerto Rico (Domain 04). Photo credit: Zachary Kaylar.
Selecting the right measurement tools to measure the impact of natural disturbances and monitor ecosystem recovery is important. If the tools used are not sensitive enough or do not provide the right information, researchers may miss important clues that could guide better restoration or land management decisions. Zachary hopes to have opportunities to repeat the study in different regions to see if the results vary for different soil types and climate zones.
“We need to take care of our soils if we want them to be sustainable for the future,” he says. “It’s important to understand the limits of our current testing methods so we can better monitor soil health and make effective decisions. We may need a combination of methods, or new methods entirely, to get an overall picture of soil health, especially as climates and ecosystems change.”