Touring NEON’S Airborne Observation Platform (AOP) in the Mid-Atlantic Domain
August 31, 2022
By Lorena Villanueva-Almanza, Landscape Exchange Network for Socio-environmental Systems (LENS)
Although LiDAR data captured from satellites, drones, and even planes similar to the one carrying the AOP have been available for years, the combination of these three instruments together is what gives it its extraordinary power.
“The AOP is an amazingly complex set of inter-linked, cutting-edge precision instruments,” writes Dr. Brenden McNeil, an associate professor of Geography at West Virginia University who visited the AOP. McNeil uses NEON AOP to draw connections between the structure and functioning of individual trees and scales it to whole forest landscapes.
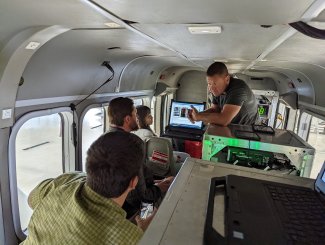
ASO Abe Morrison conducting a tour with Yiting Fan, Andrew Elmore, and Brenden McNeil while AOP based in Winchester, VA for flights over Domain 02, Mid-Atlantic. Photo credit: Mitch Haynes.
Yiting Fan, a PhD student at West Virginia University adds, “Forest study relies heavily on high resolution remote sensing data —LiDAR— for structural delineation, and multi-hyper spectral imageries and digital photography for functioning.”
But capturing good quality data to ask questions about forest structure and function is not an easy feat. Mitch Haynes, an Airborne Sensor Operator with Battelle since 2016, coordinates with NEON scientists to schedule flights when good climatological conditions and peak greenness coincide. This is the best time for researchers to learn about how plants are taking up nutrients and water.
Andrew Elmore, professor of landscape ecology at the University of Maryland Center for Environmental Science and LENS Principal Investigator who was part of the tour, was also surprised to learn how much planning is required to ensure the quality of the data. [Elmore is also a NEON Ambassador]
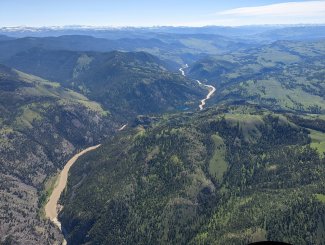
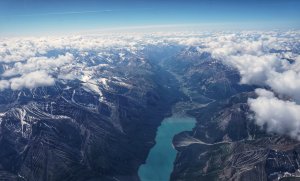
Image taken in Domain 12, Northern Rockies, over Yellowstone National Park and Yellowstone River. Operators were able to collect data with the AOP not long after the Yellowstone floods this summer. Photo credit: Mitch Haynes.
The imaging spectrometer is especially sensitive to aerosols and moisture in the sky as they affect how light is reflected from the leaf surfaces. “[A]nything between the Sun and the Earth surface could potentially show up in the data,” Haynes explains.
The NEON imaging spectrometer, which is a part of the AOP, measures the amount of light radiating off the Earth’s surface due to reflected sunlight. Reflectance will vary depending on the structure and chemical composition of vegetation. For example, different species making up a forest canopy can each have different amounts of leaf chlorophyll and water, influencing the spectral signature retrieved by the AOP.
Image taken in Domain 12, Northern Rockies, over Yellowstone National Park and Yellowstone River. Operators were able to collect data with the AOP not long after the Yellowstone floods this summer. Photo credit: Mitch Haynes.
Unlike the human eye, which is only able to perceive the visible range of the spectrum (400–800 nm) in wide bands corresponding to the Blue, Green, and Red wavelengths, the NEON imaging spectrometer making up the AOP can additionally detect wavelengths in the visible-to-near infrared (380–2510 nm). If you want to learn more about this state-of-the-art sensor, visit NEON’s site.
McNeil compares the AOP spectrometer to the James Webb Space Telescope: “Like seeing an image of a galaxy or black hole for the first time, AOP makes the invisible, visible.”
After cleaning and uploading the data to NEON’s website, researchers can freely download and use them to measure the expansion of invasive species, identify land cover types, determine the chemical composition of plant species, or learn about the nutrient content and cycle of forests.
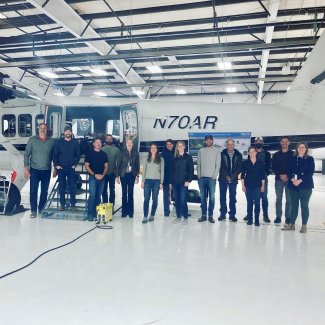
NEON’s AOP Team at the 2022 flight season kick-off breakfast at Boulder HQ Hangar.
Since the AOP officially went into operation in 2014, over 100 scientific papers have been published using or referencing the AOP. Among those is LENS’s foundational paper in Ecosphere, which you can check out here.
Researchers can also request an AOP flight deployment to collect remote sensing data for particular regions of interest through the Assignable Assets program. Learn more about it here.
McNeil, Fan, and Elmore caught the AOP during the 22-day Mid-Atlantic tour, but any scientist can ask for a tour. If you’re interested in scheduling one, check their calendar or follow updates about their flights by subscribing to their Daily Flight Reports.