Research Highlight
Scaling Models of Biodiversity
November 3, 2022
Understanding what drives biodiversity patterns is one of the fundamental questions of ecology. When it comes to animal diversity in particular, which factors matter most—localized variables (such as vegetation structure or topography) or larger regional variables? A new paper in Journal of Animal Ecology uses NEON data to explore relationships between animal species richness and various local and regional variables. The goal? To determine which variables have the best predictive power for species richness at different scales.
Species Richness at Local and Regional Scales
Dr. Luis Carrasco, lead author of the study, completed the research as part of a fellowship at the University of Tennessee funded by the National Institute of Mathematical and Biological Synthesis (NIMBioS). (Carrasco is now working as an applied scientist at Descartes Labs.) He explains, "There is a question in ecology of whether relationships between biodiversity and environmental variables can be scaled. In other words, can we generalize those relationships across both local and global scales? We wanted to know if the relationships stayed stable across scales, in different geographies, and between different species." A better understanding of the drivers of biodiversity and how they work at different scales will help researchers build better predictive models.
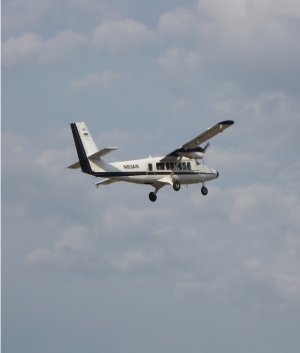
To answer these questions, Carrasco and his co-authors leveraged NEON data for small mammals, ground beetles, and land birds to explore species richness at 27 NEON terrestrial field sites at individual plot and whole site levels. Species richness is a very simple measure of biodiversity that just looks at the total number of different species found in an area within each taxonomic group, without any measure of relative abundance. Concurrently-collected meteorological and airborne remote sensing data at the NEON sites allowed them to look for correlations between species richness and environmental variables at both the plot level and site level. Lidar data from the NEON airborne observation platform (AOP) provided information on site topography and vegetation structure, while data, including temperature and precipitation, was taken from site metadata. Glacial history (not a NEON data product) was used as a proxy for site history.

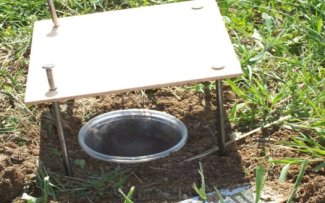
Pitfall trap used for beetle data collection
Carrasco says, "The good thing about NEON data is we can get data at a very granular scale, down to the individual plot level, so we have very high-resolution data. However, we can also look across geographies, from the site level to the continental level. Having data at these high resolutions across this wide geographical extent is pretty unique in ecology." In most ecological studies, there is a tradeoff between data resolution and geographic extent. One study may collect high-resolution data (e.g., 1 m2) at a single site, for example, while another may use remote sensing data to look at variables across large distances but at very low resolution (e.g., 1 km2). NEON's nested spatial design gives researchers high-resolution data collected in the same way at sites across the continent representing different biomes and zones.
The authors used a method called hierarchical modeling to analyze the data. The hierarchical model enables researchers to explore relationships between species richness and the various drivers at different scales, from plot-level to site-level to the larger regional or continental scale. Carrasco explains, "We used this to control for the NEON site grouping of plots, and to apply a variance partitioning method to study which variables were most important at each scale."
Can Models of Biodiversity Be Scaled?
The study found that site-level (regional) variables have greater predictive power for all three groups than plot-level (local) variables, such as topography and vegetation structure. For land birds and ground beetles, temperature appears to have the greatest impact on species richness. At the plot level, land birds are most sensitive to variation in 3D vegetation structure. Small mammals do not show as much variation based on these environmental factors, though past glacial history does have some predictive power.
Carrasco says the findings suggest that it is very difficult to generalize models of biodiversity across scales or between different taxonomic groups or geographic areas. While regional variables show greater predictive power overall, there are still significant differences in how each group responds to environmental variables. He explains, "What this says is that we possibly can't make general, universal rules explaining patterns in biodiversity that hold up across geographies, scales and species. We may have to go case by case to explain local species richness."
Understanding the drivers of biodiversity is important because biodiversity is an indicator of ecosystem health and productivity. More diverse ecosystems are believed to be more resilient and better able to adapt to stress from change or human activity. Diverse ecosystems also tend to provide more ecosystem services, ranging from carbon capture potential to pollinators for food crops. Better models of biodiversity would help us understand which ecosystems are most essential to protect and which aspects of those ecosystems are most critical for maintaining diversity of different taxa.
While this study did not find the universal rules the authors hoped for, it suggests that large-scale data networks like the NEON program could be the key to refining our models for biodiversity for different taxa, regions, and landscape types. Carrasco hopes to see other researchers carry this work forward. In particular, he would like to see how the predictive models they developed hold over time as the NEON program matures. This study only had two to three years of data for each of the included NEON sites. He says, "When NEON has data for ten years or more, we'll be able to look across time to see how these relationships are changing. That could tell us more about the anthropogenic effects of change and habitat loss." He also suggests that future studies could explore these relationships across more biomes globally or look beyond species richness to other biodiversity indicators.
He says, "The question of why there is more biodiversity in one place vs. another is important. In this study, we did something new by separating out the effects of these different variables at different scales. It allowed us to see the relative impact of local, plot-level environmental characteristics vs. larger regional variables acting at the site scale. This will help us build better theories to explain biodiversity for different species groups or geographies."

