NSF NEON, Operated by Battelle

Main navigation

  • About Us
    • Overview
      • Spatial and Temporal Design
      • History
    • Vision and Management
    • Advisory Groups
      • Science, Technology & Education Advisory Committee
      • Technical Working Groups (TWGs)
    • FAQ
    • Contact Us
      • Contact NEON Biorepository
      • Field Offices
    • User Accounts
    • Staff
    • Code of Conduct

    About Us

  • Data & Samples
    • Data Portal
      • Explore Data Products
      • Data Availability Charts
      • Spatial Data & Maps
      • Document Library
      • API & GraphQL
      • Prototype Data
      • External Lab Data Ingest (restricted)
    • Data Themes
      • Biogeochemistry
      • Ecohydrology
      • Land Cover and Processes
      • Organisms, Populations, and Communities
    • Samples & Specimens
      • Discover and Use NEON Samples
        • Sample Types
        • Sample Repositories
        • Sample Explorer
        • Megapit and Distributed Initial Characterization Soil Archives
      • Sample Processing
      • Sample Quality
      • Taxonomic Lists
    • Collection Methods
      • Protocols & Standardized Methods
      • Airborne Remote Sensing
        • Flight Box Design
        • Flight Schedules and Coverage
        • Daily Flight Reports
          • AOP Flight Report Sign Up
        • Camera
        • Imaging Spectrometer
        • Lidar
      • Automated Instruments
        • Site Level Sampling Design
        • Sensor Collection Frequency
        • Instrumented Collection Types
          • Meteorology
          • Phenocams
          • Soil Sensors
          • Ground Water
          • Surface Water
      • Observational Sampling
        • Site Level Sampling Design
        • Sampling Schedules
        • Observation Types
          • Aquatic Organisms
            • Aquatic Microbes
            • Fish
            • Macroinvertebrates & Zooplankton
            • Periphyton, Phytoplankton, and Aquatic Plants
          • Terrestrial Organisms
            • Birds
            • Ground Beetles
            • Mosquitoes
            • Small Mammals
            • Soil Microbes
            • Terrestrial Plants
            • Ticks
          • Hydrology & Geomorphology
            • Discharge
            • Geomorphology
          • Biogeochemistry
          • DNA Sequences
          • Pathogens
          • Sediments
          • Soils
            • Soil Descriptions
        • Optimizing the Observational Sampling Designs
    • Data Notifications
    • Data Guidelines and Policies
      • Acknowledging and Citing NEON
      • Publishing Research Outputs
      • Usage Policies
    • Data Management
      • Data Availability
      • Data Formats and Conventions
      • Data Processing
      • Data Quality
      • Data Product Bundles
      • Data Product Revisions and Releases
        • Release 2021
        • Release 2022
        • Release 2023
        • Release 2024
        • Release-2025
      • NEON and Google
      • Externally Hosted Data

    Data & Samples

  • Field Sites
    • About Field Sites and Domains
    • Explore Field Sites
    • Site Management Data Product

    Field Sites

  • Impact
    • Observatory Blog
    • Case Studies
    • Papers & Publications
    • Newsroom
      • NEON in the News
      • Newsletter Archive
      • Newsletter Sign Up

    Impact

  • Resources
    • Getting Started with NEON Data & Resources
    • Documents and Communication Resources
      • Papers & Publications
      • Document Library
      • Outreach Materials
    • Code Hub
      • Code Resources Guidelines
      • Code Resources Submission
      • NEON's GitHub Organization Homepage
    • Learning Hub
      • Science Videos
      • Tutorials
      • Workshops & Courses
      • Teaching Modules
    • Research Support Services
      • Field Site Coordination
      • Letters of Support
      • Mobile Deployment Platforms
      • Permits and Permissions
      • AOP Flight Campaigns
      • Research Support FAQs
      • Research Support Projects
    • Funding Opportunities

    Resources

  • Get Involved
    • Advisory Groups
      • Science, Technology & Education Advisory Committee
      • Technical Working Groups
    • Upcoming Events
    • NEON Ambassador Program
      • Exploring NEON-Derived Data Products Workshop Series
    • Research and Collaborations
      • Environmental Data Science Innovation and Inclusion Lab
      • Collaboration with DOE BER User Facilities and Programs
      • EFI-NEON Ecological Forecasting Challenge
      • NEON Great Lakes User Group
      • NEON Science Summit
      • NCAR-NEON-Community Collaborations
        • NCAR-NEON Community Steering Committee
    • Community Engagement
      • How Community Feedback Impacts NEON Operations
    • Science Seminars and Data Skills Webinars
      • Past Years
    • Work Opportunities
      • Careers
      • Seasonal Fieldwork
      • Internships
        • Intern Alumni
    • Partners

    Get Involved

  • My Account
  • Search

Search

Impact

  • Observatory Blog
  • Case Studies
  • Papers & Publications
  • Newsroom

Breadcrumb

  1. Impact
  2. Observatory Blog
  3. The power of measuring vertical wind profiles using NEON towers

The power of measuring vertical wind profiles using NEON towers

November 19, 2015

CPER Tower

By Leslie Goldman & Cove Sturtevant

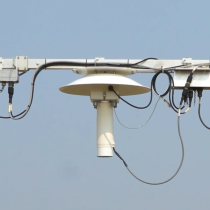
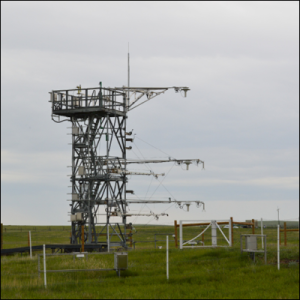
Did you know that wind speed can be determined by measuring the speed of sound? Since sound is “carried” by the wind, the speed of sound will be faster in the direction that the wind is blowing. These measurements can be collected using sonic anemometers. The sonic anemometer mounted at the top of NEON flux towers measures horizontal and vertical wind speed, and sonic anemometers mounted at lower levels of the towers measure horizontal wind speed. Measurements are collected in the same fashion across all NEON towers allowing for comparisons between sites, and preliminary wind speed data are currently available from many field sites.


Standardized monitoring of the flux scale at NEON field sites

Wind speed is just one of many standardized flux scale measurements that will take place at NEON’s terrestrial field sites across the U.S. over the next 30 years. Tower sensors monitor physical and chemical properties of the atmosphere, such as wind speed, humidity, carbon dioxide and reactive nitrogen. From these sensors we can measure net ecosystem exchange or the amount of gas that is exchanged between the atmosphere and the ecosystem.

The towers extend past the top of the vegetation canopy at each site to allow sensors mounted at the top and along the tower to capture the full profile of atmospheric conditions from above the vegetation canopy to the ground. Automated tower sensors collect data continuously to capture patterns and cycles across various time periods, ranging from seconds to years.

Determining the flux scale

The vertical wind profile provided by NEON towers makes estimation of surface properties that determine the flux scale simple and direct. The vertical wind profile (how average wind speed varies with height above the ground) follows a characteristic logarithmic relationship from which we can derive several important physical properties of the surface. These properties include the zero-plane displacement of the wind profile and the surface roughness which strongly influence the source area of the mass, energy, and momentum fluxes measured by the tower.

In comparison, most existing flux-measurement towers are equipped with only eddy covariance instrumentation at the tower top, which requires the use of general parameterizations, greater assumptions, or less-direct methods of estimating surface properties.

Once fully operational, NEON will provide additional field site data such as gas concentration measurements, soil measurements at varying depths and airborne collected LiDAR and hyperspectral data. Some of these data may be combined with the vertical wind profile data to allow for the estimation of surface-atmosphere exchange with multiple methods (eddy covariance and flux-gradient), which allows independent comparison analyses and verification of flux measurements. The remainder will help users of NEON data interpret the variability in the fluxes to understand how and why ecosystems change over time.

Data skills and accessing the data

To work with wind speed data, users require moderately-advanced data skills, with basic knowledge of algorithmic programming such as R.

In the long term, all terrestrial NEON sites will collect 1 & 30 minute averages of wind speed, providing data for a variety of users including micrometeorologists and biometeorologists, from graduate students to senior research scientists.

These data can be used to compare surface properties over time and spatially across NEON sites which are strategically placed within 20 ecoclimatic domains to ensure statistical representation of ecological, physical and biological variability.

To explore currently available wind speed data, go to the NEON Data Portal and browse by the Atmospheric Data theme. These data are available from April, 2015 - Present from 15 field sites.

Bonus! Click this link to download the function Cove coded in R to compute the surface properties relevant to the figure in this story.

Share

Related Posts:

2025 Data Release: Update to timestamp offset in data from all Picarro instruments

February 25, 2025

NEON Data Release 2025 is available

January 29, 2025

A Chance for Fire Research and Recovery at a NEON Desert Site

January 24, 2025

Burned cactus
NSF NEON, Operated by Battelle

Follow Us:

Join Our Newsletter

Get updates on events, opportunities, and how NEON is being used today.

Subscribe Now

Footer

  • About Us
  • Newsroom
  • Contact Us
  • Terms & Conditions
  • Careers
  • Code of Conduct

Copyright © Battelle, 2025

The National Ecological Observatory Network is a major facility fully funded by the U.S. National Science Foundation.

Any opinions, findings and conclusions or recommendations expressed in this material do not necessarily reflect the views of the U.S. National Science Foundation.