NSF NEON, Operated by Battelle

Main navigation

  • About
    • NEON Overview
      • Vision and Management
      • Spatial and Temporal Design
      • History
    • About the NEON Biorepository
      • ASU Biorepository Staff
      • Contact the NEON Biorepository
    • Observatory Blog
    • Newsletters
    • Staff
    • FAQ
    • Contact Us

    About

  • Data
    • Data Portal
      • Data Availability Charts
      • API & GraphQL
      • Prototype Data
      • Externally Hosted Data
    • Data Collection Methods
      • Airborne Observation Platform (AOP)
      • Instrument System (IS)
        • Instrumented Collection Types
        • Aquatic Instrument System (AIS)
        • Terrestrial Instrument System (TIS)
      • Observational System (OS)
        • Observation Types
        • Observational Sampling Design
        • Sampling Schedules
        • Taxonomic Lists Used by Field Staff
        • Optimizing the Observational Sampling Designs
      • Protocols & Standardized Methods
    • Getting Started with NEON Data
      • neonUtilities for R and Python
      • Learning Hub
      • Code Hub
    • Using Data
      • Data Formats and Conventions
      • Released, Provisional, and Revised Data
      • Data Product Bundles
      • Usage Policies
      • Acknowledging and Citing NEON
      • Publishing Research Outputs
    • Data Notifications
    • NEON Data Management
      • Data Availability
      • Data Processing
      • Data Quality

    Data

  • Samples & Specimens
    • Biorepository Sample Portal at ASU
    • About Samples
      • Sample Types
      • Sample Repositories
      • Megapit and Distributed Initial Characterization Soil Archives
    • Finding and Accessing Sample Data
      • Species Checklists
      • Sample Explorer - Relationships and Data
      • Biorepository API
    • Requesting and Using Samples
      • Loans & Archival Requests
      • Usage Policies

    Samples & Specimens

  • Field Sites
    • Field Site Map and Info
    • Spatial Layers & Printable Maps

    Field Sites

  • Resources
    • Getting Started with NEON Data
    • Research Support Services
      • Field Site Coordination
      • Letters of Support
      • Mobile Deployment Platforms
      • Permits and Permissions
      • AOP Flight Campaigns
      • Research Support FAQs
      • Research Support Projects
    • Code Hub
      • neonUtilities for R and Python
      • Code Resources Guidelines
      • Code Resources Submission
      • NEON's GitHub Organization Homepage
    • Learning Hub
      • Tutorials
      • Workshops & Courses
      • Science Videos
      • Teaching Modules
    • Science Seminars and Data Skills Webinars
    • Document Library
    • Funding Opportunities

    Resources

  • Impact
    • Research Highlights
    • Papers & Publications
    • NEON in the News

    Impact

  • Get Involved
    • Upcoming Events
    • Research and Collaborations
      • Environmental Data Science Innovation and Inclusion Lab
      • Collaboration with DOE BER User Facilities and Programs
      • EFI-NEON Ecological Forecasting Challenge
      • NEON Great Lakes User Group
      • NCAR-NEON-Community Collaborations
    • Advisory Groups
      • Science, Technology & Education Advisory Committee
      • Technical Working Groups
    • NEON Ambassador Program
      • Exploring NEON-Derived Data Products Workshop Series
    • Partnerships
    • Community Engagement
    • Work Opportunities

    Get Involved

  • My Account
  • Search

Search

About

  • NEON Overview
  • About the NEON Biorepository
  • Observatory Blog
  • Newsletters
  • Staff
  • FAQ
  • Contact Us

Breadcrumb

  1. About
  2. Observatory Blog
  3. NEON Sites Show Their Colors: Fall Across the Observatory

NEON Sites Show Their Colors: Fall Across the Observatory

November 22, 2023

fall color at TREE

Fall arrives at different times and in different ways across the Observatory. Thanks to the phenocams across the NEON field sites, here's a glimpse at how autumn is unrolling across the continent and how 2023 looks compared to 2022.

Fall Phenology: North to South and East to West

In the context of plant phenology, "fall" (or autumn) is defined by specific biological events and changes observed in plants as they respond to the decreasing daylight and cooling temperatures typical of this time of year in the northern hemisphere. In habitats with deciduous trees, the most noticeable and dramatic sign of fall is the changing color pallet, as green leaves turn vibrant shades of red, orange, yellow, and eventually brown. Other phenological signs of autumn include leaf drop (for deciduous plants), fruit ripening or seed dispersal for some species, changes in growth patterns, and the onset of dormancy for many trees and plants. The timing of these events is closely tied to latitude and geography. In North America, fall generally starts first in the northern latitudes due to the cooler temperatures and greater variation in daylight length. The timing of color change and other phenological events is also tied to elevation, regional weather patterns, and other variables.

Northeast (D01)

Fall color change at HARV

Fall color change at HARV (Domain 01) in 2023. Oct 17 - Nov 5.

Mid-Atlantic (D02)

SCBI fall color change

Fall color change at SCBI (Domain 02) in 2023. Oct 1 - Nov 1.

Ozarks Complex (D08)

Fall color change at DELA

Fall color change at DELA (Domain 08) in 2023. Oct 1 - Nov 6.

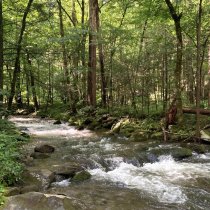
Pacific Northwest (D16)

Fall color change at ABBY

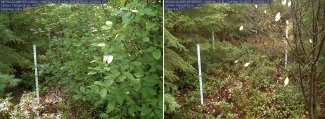
Fall color change at ABBY (Domain 16) in 2023. Oct 1 - Nov 11.

Pacific Southwest (D17)

Fall color change at SOAP

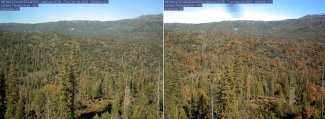
Fall color change at SOAP (Domain 17) in 2023. Oct 19 - Nov 21.

Taiga (D19)

fall color change at DEJU

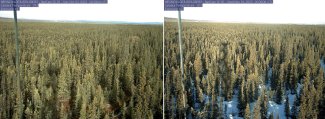
Fall color change at DEJU (Domain 19) in 2023. Oct 1 - Nov 1. The photos are shown at the same time of day one month apart, with the Arctic polar night approaching and daylight much less at the same time of day in November.

Fall from Year to Year

The variation in fall phenology from year to year is significantly influenced by weather patterns. These variations can alter the timing and intensity of typical autumnal events like leaf color change, fruit ripening, and the onset of dormancy in plants. In 2023, scorching heat and drought in some areas, and too much rain in others, meant many regions expected a less colorful leaf display. In the Northeast, it also seemed that peak color came a little bit later in the season.
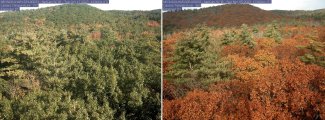
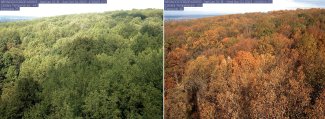
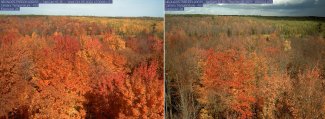
Mid-Atlantic (D02)

Peak color comparison at SERC

Peak fall color comparison at SERC (Domain 02), 2022 vs. 2023. Both photos taken Nov 1.
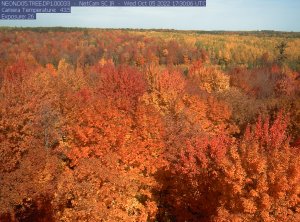
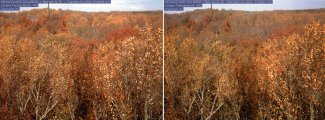
Great Lakes (D05)

Peak color comparison at TREE

Peak fall color comparison at TREE (Domain 05), 2022 vs. 2023. Both photos taken Oct 5.

Northeast (D01)

Peak greenness BART site

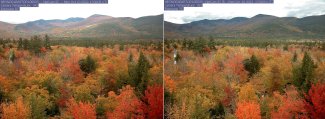
Peak fall color comparison at BART (Domain 01), 2022 vs. 2023. First photo taken Oct 10, 2022; second photo taken Oct 18, 2023. It appears peak color came a full week later in 2023.

Want More Fall Phenology?

Check out our phenocam images to see what's happening at every NEON field site. The latest image for each site is shown on this page. Past images are housed by the PhenoCam Network and available in the NEON Data Portal.

Share

Related Posts:

Discontinuation of Select NEON Data Products

January 29, 2026

Modification of Select NEON Data Products

January 29, 2026

Continuous discharge (DP4.00130.001) changing to 15-min average

January 23, 2026

NSF NEON, Operated by Battelle

Follow Us:

Join Our Newsletter

Get updates on events, opportunities, and how NEON is being used today.

Subscribe Now

Footer

  • About Us
  • Contact Us
  • Terms & Conditions
  • Careers
  • Code of Conduct

Copyright © Battelle, 2026

The National Ecological Observatory Network is a major facility fully funded by the U.S. National Science Foundation.

Any opinions, findings and conclusions or recommendations expressed in this material do not necessarily reflect the views of the U.S. National Science Foundation.