Atmospheric Methane Concentrations Now Available by Popular Demand
January 5, 2022
Guess what—we have an all-new data product! The “L1 Methane Concentration” is now available on the NEON Data Portal, with data from July 15, 2021, and going forward.
We made this change in response to popular demand from our user community. Here’s why atmospheric methane concentrations matter, and what you can expect to see on the portal.
Why Worry About Methane?
Methane (CH4) is a colorless, odorless, and tasteless gas that is lighter than air. It is also a potent greenhouse gas (GHG) that has been linked to climate change. While atmospheric methane concentrations are much lower than carbon dioxide (CO2) concentrations, methane may deliver more than 80 times the Global Warming Potential (GWP) of CO2 over a twenty-year timeframe. Knowing how much methane is in the atmosphere and how that concentration is changing over time is critical for understanding and predicting climate change.
Methane is emitted from both natural sources and human activities. It is a natural byproduct when organic material decays under anaerobic conditions. Natural sources include wetlands, animal and insect activity and digestion, oxygen-depleted freshwater reservoirs, and venting of underground methane stores through terrestrial and oceanic seeps or volcanoes. Wildfires also release methane into the atmosphere along with carbon dioxide. The main sink for atmospheric methane is oxidation; CH4 reacts with OH and is eventually converted to CO2 and hydrogen.
Today, about 50-65% of total CH4 emissions comes from human activity. Global atmospheric concentrations have more than doubled over the last 200 years. Predominantly anthropogenic sources for methane include:
- Agriculture
- Fossil fuel production and combustion
- Landfills
- Wastewater treatment
Understanding the relative contributions of various methane sources and sinks will be very important as researchers refine climate change predictions. More research is needed to understand methane emissions and uptake across different types of ecosystems and how methane concentration levels are changing in response to land use, climate change, and natural disturbances such as floods or wildfires. Data from the NEON program can help answer these urgent questions.
Collecting Methane Data from the NEON Eddy Flux Towers
The new data product was created in response to requests from our user communities, including large organizations such as NOAA and AmeriFlux that utilize NEON data products. Dr. Mike SanClements, the lead for the Terrestrial Instrument Systems (TIS), says, “We never make changes to our science design lightly, but adding methane was really a no-brainer. It came directly out of requests from our user community and the Technical Working Groups. And adding methane to our data products does not require the addition of any new instrumentation.”
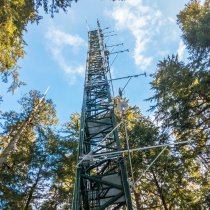
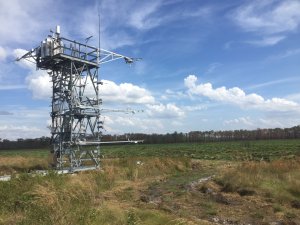
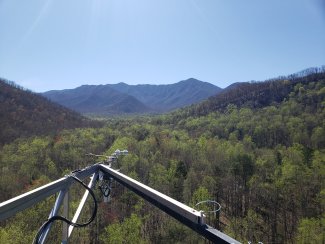
Methane concentrations are collected using the same instrument used for collection of CO2 isotope and gas concentration data, the Picarro G2131-i analyzer. The Picarro is a standard instrument on the NEON micrometeorological towers, which are located on 47 terrestrial field sites. The towers are equipped with a variety of sensors to collect meteorological and eddy flux data. Picarro sensors are located in the instrument hut and sequentially measure the CO2 and CH4 gas concentrations of air parcels at different heights within and above the vegetation canopy, which are delivered to the instrument through tubing and pumps.
The Picarro G2131-i sensors were always capable of collecting methane data, but originally the methane channel in the instrument was not calibrated; thus, the methane data stream was not being turned into a data product. As with all changes to the NEON science design, calibrating the instrument with methane reference gases and adding the atmospheric methane concentration data product required approval from the National Science Foundation (NSF), which funds the NEON program.
The change was approved in late 2019 after submission of letters of support from the Technical Working Groups (TWGs) and data users, including NOAA and AmeriFlux. In a letter to NEON’s Science, Technology, and Education Advisory Committee (STEAC), James Butler, director of the Earth System Research Laboratory (ESRL) Global Monitoring Division (GMD) at NOAA, said, “We highly support the inclusion of methane as a NEON data product. The shared interest in monitoring changes in fluxes of CO2 and CH4 is of particular interest to GMD and provides an excellent opportunity for enhanced collaboration and shared resources.”
Over the last year, the NEON Instrument System team has been working to standardize and calibrate the methane channel in the Picarro G2131-i sensors, collect raw methane data from field sites, and develop code to transition raw methane data to the L1 methane concentration data product. L1 Methane Concentration is now available in the NEON Data Portal with data from July 15, 2021, and forward. Historical methane data collected by the Picarro sensors prior to July 2021 will not be available in the Data Portal because they had not been standardized and calibrated.
Critical Data for Climate Change Modeling
Methane data from the NEON field sites will fill critical holes in our understanding of methane sources and sinks in different types of ecosystems. Currently, most researchers studying methane have concentrated on wetlands, where most methane emissions are produced. Less is known about methane emissions or uptake in drier upland areas.
Dr. Chris Florian, a NEON research scientist and one of the leads in developing L1 CH4 concentration data product, says, “When we were talking to [data users] at AmeriFlux, they said, ‘you have all these upland sites where people haven’t been monitoring, and we really would like to have that data.’ Historically, these landscapes were considered less important for understanding the methane cycle, but now we have an opportunity to test those assumptions and build better models of methane uptake and emissions in different types of landscapes. Because NEON sites are part of AmeriFlux, adding methane data collection at the NEON towers will double the inputs that AmeriFlux has for methane analysis.”
This additional methane concentration data product will eventually enable the methane flux calculation using the flux-gradient method. In their letter of support to the NSF in 2019, AmeriFlux noted, “Increasing the number of sites measuring methane fluxes is a priority for the AmeriFlux Management Project. This is the AmeriFlux Year of Methane. We chose this as our first theme year for network action because observations of methane flux are valuable, and we think it is important to increase the number of sites producing flux estimates.”
The NEON field sites also provide a rich opportunity to study the impact of agriculture on methane emissions. 12 terrestrial field sites are located on agricultural lands, including three sites colocated with Long-Term Agroecosystem Research (LTAR) sites managed by the U.S. Department of Agriculture (USDA). Most of these sites are dedicated to cattle grazing. Comparing methane concentrations at grazed and non-grazed sites, or sites with different land management practices, could provide a clearer picture of agricultural methane emissions.
There are many additional questions around methane emissions and climate change. For example, as temperatures rise in tundra and taiga biomes, many researchers believe that thawing permafrost could soon release large amounts of methane that is currently trapped in the frozen ground. Data from our field sites in Alaska could help scientists monitor methane emissions from permafrost.
Help us to Calculate Methane Flux
Currently, only Level 1 (directly measured) concentration data are available for methane. The new L1 Methane Concentration data product does not provide direct measurement of methane flux. However, it will enable derived (L4) calculation of methane fluxes using the flux-gradient method. NEON is currently looking for collaborators who would be interested in calculating derived methane flux data from the L1 data product. Interested researchers or programmers can contact Chris Florian (cflorian@battelleecology.org).