Tutorial
Quantifying The Drivers and Impacts of Natural Disturbance Events – The 2013 Colorado Floods
Last Updated: Apr 2, 2026
The 2013 Colorado Front Range Flood
Why was the Flooding so Destructive?
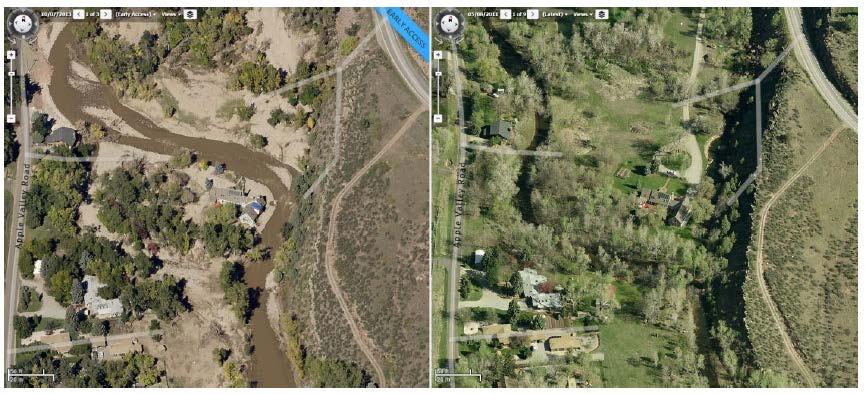
A major disturbance event like this flood causes significant changes in a landscape. The St. Vrain River in the image above completely shifted its course of flow in less than 5 days! This brings major changes for aquatic organisms, like crayfish, that lived along the old stream bed that is now bare and dry, or for, terrestrial organisms, like a field vole, that used to have a burrow under what is now the St. Vrain River. Likewise, the people living in the house that is now on the west side of the river instead of the eastern bank have a completely different yard and driveway!
- Why might this storm have caused so much flooding?
- What other weather patterns could have contributed to pronounced flooding?
Introduction to Disturbance Events
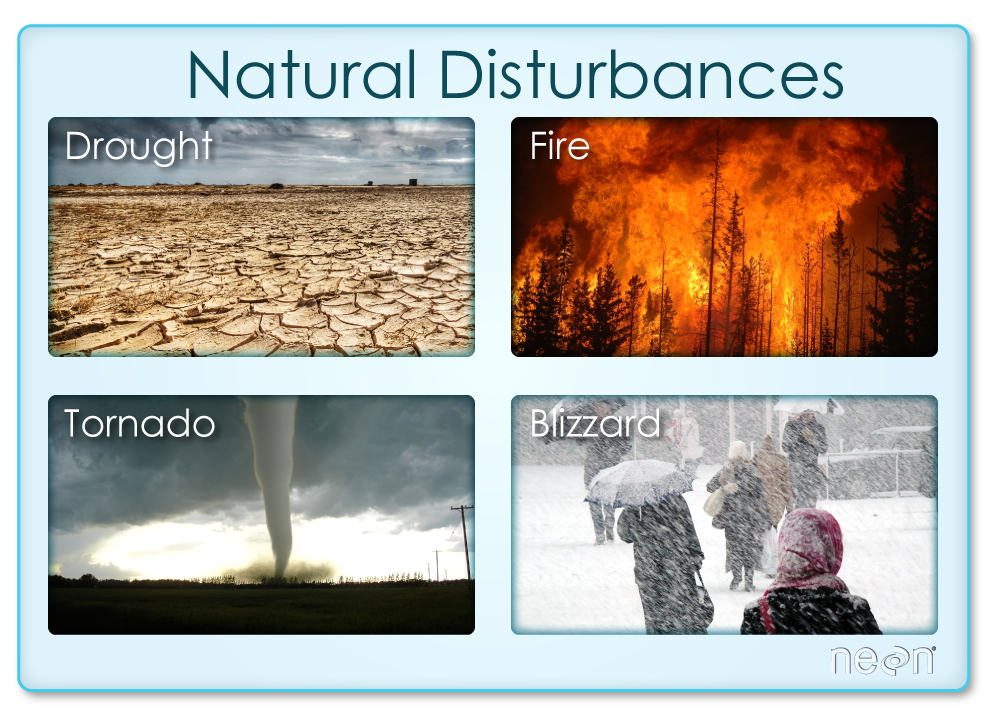
Definition: In ecology, a disturbance event is a temporary change in environmental conditions that causes a pronounced change in the ecosystem. Common disturbance events include floods, fires, earthquakes, and tsunamis.
Within ecology, disturbance events are those events which cause dramatic change in an ecosystem through a temporary, often rapid, change in environmental conditions. Although the disturbance events themselves can be of short duration, the ecological effects last decades, if not longer.
Common examples of natural ecological disturbances include hurricanes, fires, floods, earthquakes and windstorms.
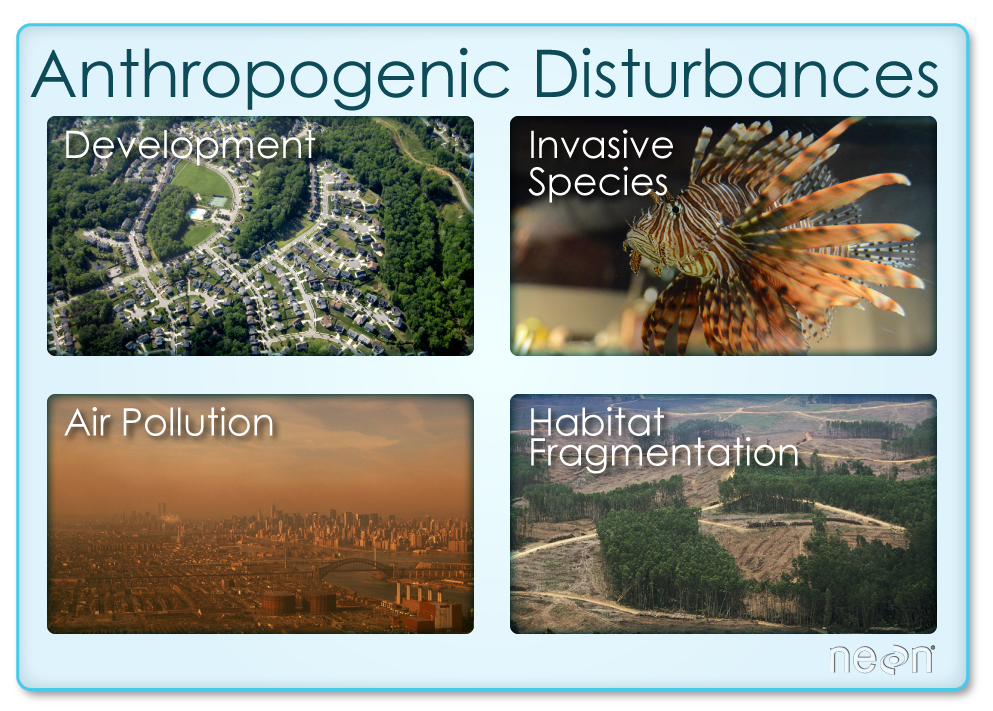
Disturbance events can also be human caused: clear cuts when logging, fires to clear forests for cattle grazing or the building of new housing developments are all common disturbances.
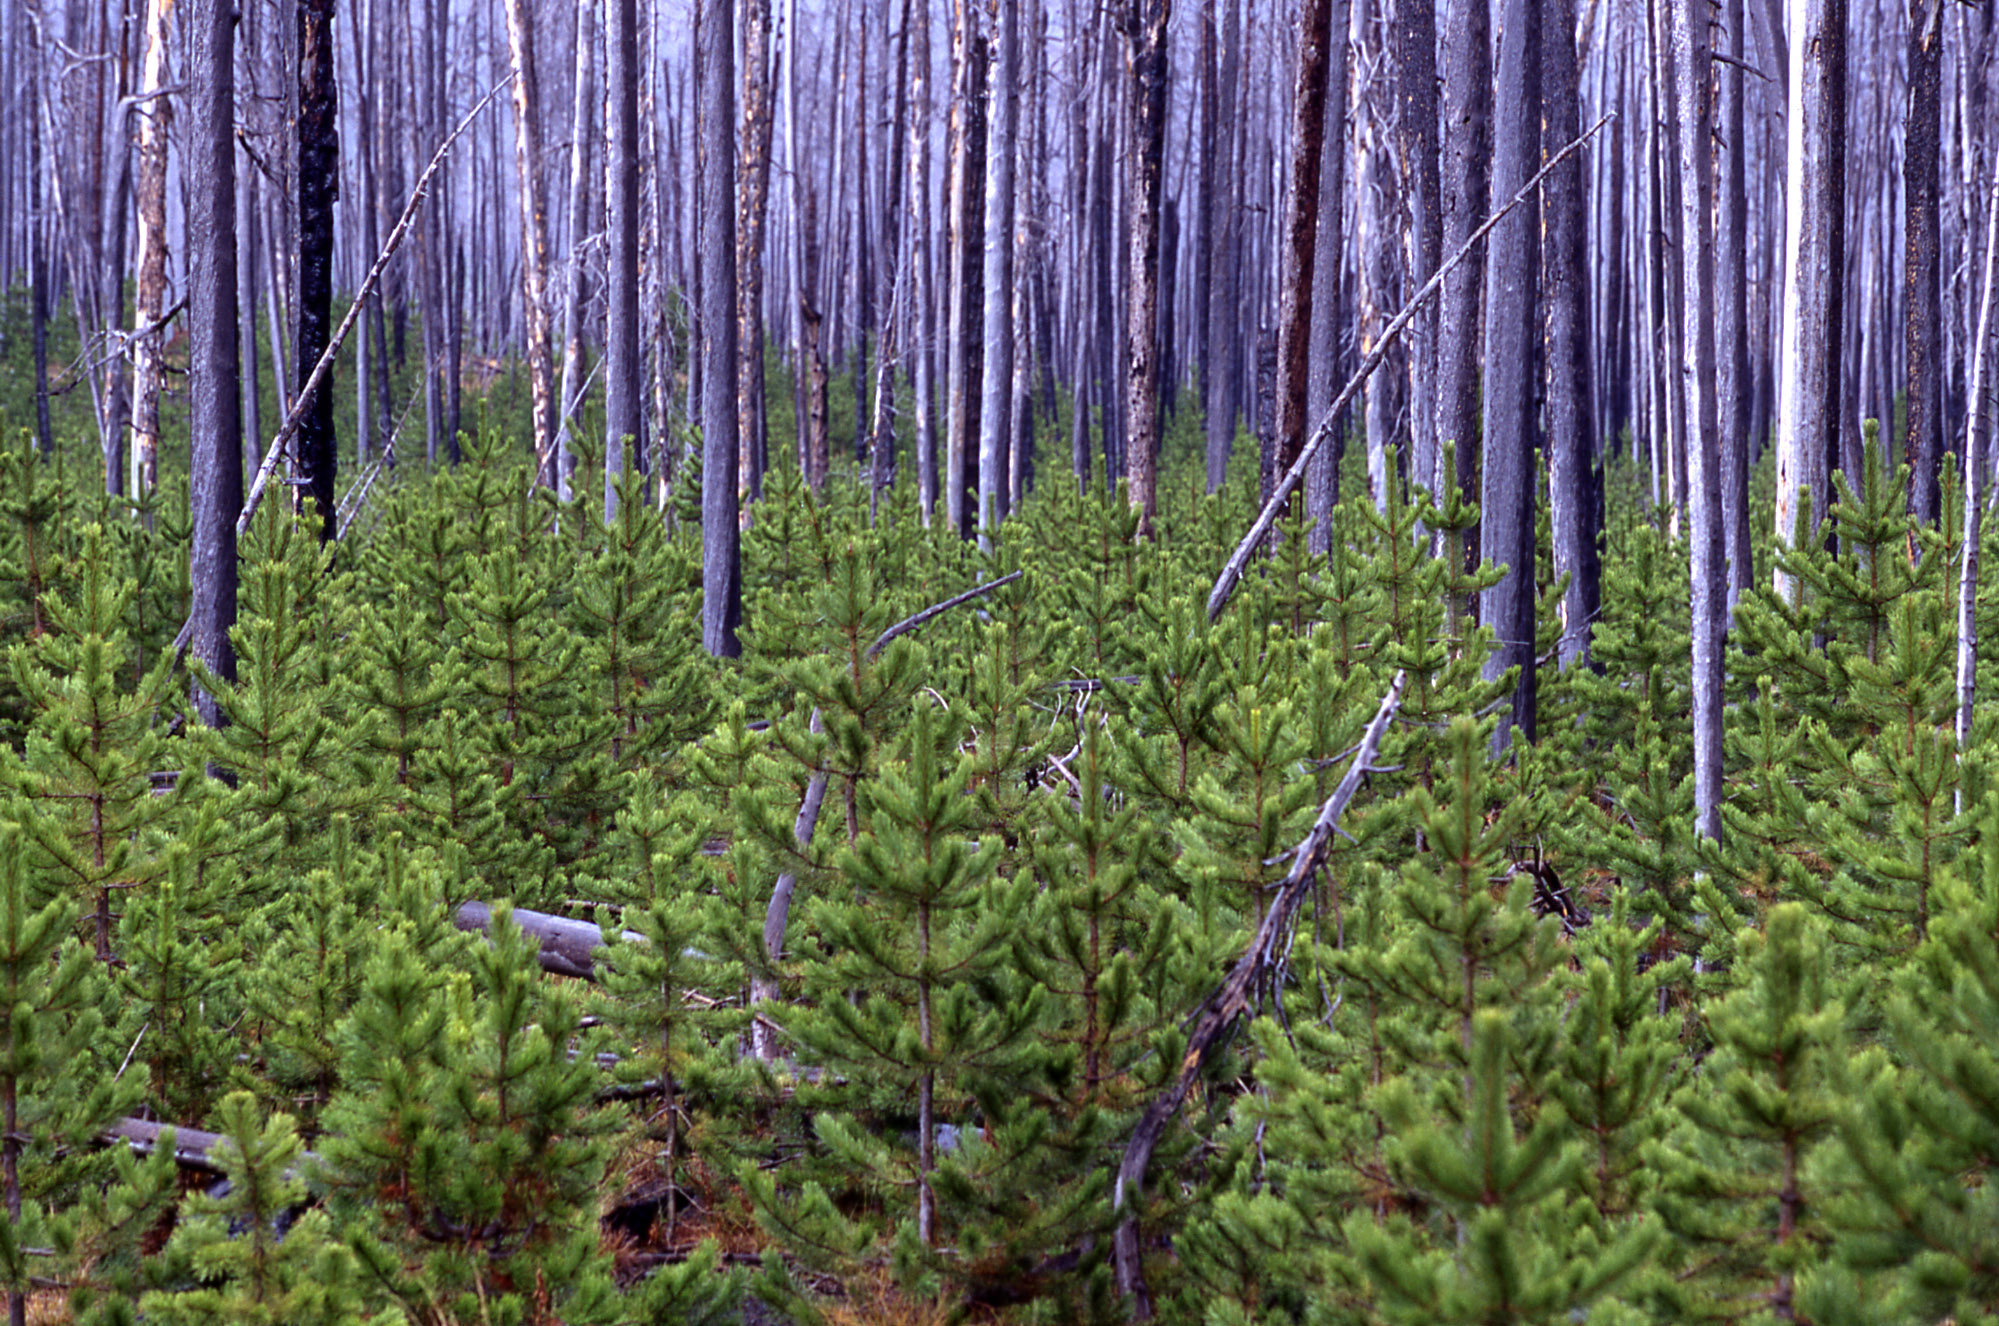
Ecological communities are often more resilient to some types of disturbance than others. Some communities are even dependent on cyclical disturbance events. Lodgepole pine (Pinus contorta) forests in the Western US are dependent on frequent stand-replacing fires to release seeds and spur the growth of young trees.
However, in discussions of ecological disturbance events we think about events that disrupt the status of the ecosystem and change the structure of the landscape.
In this lesson we will dig into the causes and disturbances caused during a storm in September 2013 along the Colorado Front Range.
Driver: Climatic & Atmospheric Patterns
Drought
How do we measure drought?
Definition: The Palmer Drought Severity Index is a measure of soil moisture content. It is calculated from soil available water content,precipitation and temperature data. The values range from extreme drought (values <-4.0) through near normal (-.49 to .49) to extremely moist (>4.0).
Bonus: There are several other commonly used drought indices. The National Drought Mitigation Center provides a comparison of the different indices.
This interactive plot shows the Palmer Drought Severity Index from 1991 through 2015 for Colorado.
Palmer Drought Severity Index for Colorado 1991-2015. Source: National Ecological Observatory Network (NEON) based on data from National Climatic Data Center–NOAA.
Questions
Use the figure above to answer these questions:
- In this dataset, what years are near normal, extreme drought, and extreme wet on the Palmer Drought Severity Index?
- What are the patterns of drought within Colorado that you observe using this Palmer Drought Severity Index?
- What were the drought conditions immediately before the September 2013 floods?
Over this decade and a half, there have been several cycles of dry and wet periods. The 2013 flooding occurred right at the end of a severe drought.
There is a connection between the dry soils during a drought and the potential for flooding. In a severe drought the top layers of the soil dry out. Organic matter, spongy and absorbent in moist topsoil, may desiccate and be transported by the winds to other areas. Some soil types, like clay, can dry to a near-impermeable brick causing water to flow across the top instead of sinking into the soils.
Atmospheric Conditions
In early September 2013, a slow moving cold front moved through Colorado intersecting with a warm, humid front. The clash between the cold and warm fronts yielded heavy rain and devastating flooding across the Front Range in Colorado.

The storm that caused the 2013 Colorado flooding was kept in a confined area over the Eastern Range of the Rocky Mountains in Colorado by these water vapor systems.
Driver: Precipitation
How do we measure precipitation?
Definition: Precipitation is the moisture that falls from clouds including rain, hail and snow.
Precipitation can be measured by different types of gauges; some must be manually read and emptied, others automatically record the amount of precipitation. If the precipitation is in a frozen form (snow, hail, freezing rain) the contents of the gauge must be melted to get the water equivalency for measurement. Rainfall is generally reported as the total amount of rain (millimeters, centimeters, or inches) over a given per period of time.
Boulder, Colorado lays on the eastern edge of the Rocky Mountains where they meet the high plains. The average annual precipitation is near 20". However, the precipitation comes in many forms -- winter snow, intense summer thunderstorms, and intermittent storms throughout the year.
The figure below show the total precipitation each month from 1948 to 2013 for the National Weather Service's COOP site Boulder 2 (Station ID:050843) that is centrally located in Boulder, CO.
Notice the general pattern of rainfall across the 65 years.
- How much rain generally falls within one month?
- Is there a strong annual or seasonal pattern? (Remember, with interactive Plotly plots you can zoom in on the data)
- Do any other events over the last 65 years equal the September 2013 event?
Now that we've looked at 65 years of data from Boulder, CO. Let's focus more specifically on the September 2013 event. The plot below shows daily precipitation between August 15 - October 15, 2013.
Explore the data and answer the following questions:
- What dates were the highest precipitation values observed?
- What was the total precipitation on these days?
- In what units is this value?
Optional Data Activity: Visualize Precipitation Data in R to Better Understand the 2013 Colorado Floods.
Driver: Stream Discharge
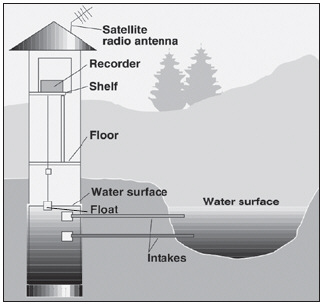
The USGS has a distributed network of aquatic sensors located in streams across the United States. This network monitors a suit of variables that are important to stream morphology and health. One of the metrics that this sensor network monitors is stream discharge, a metric which quantifies the volume of water moving down a stream. Discharge is an ideal metric to quantify flow, which increases significantly during a flood event.
How is stream discharge measured?
Most USGS streamgages operate by measuring the elevation of the water in the river or stream and then converting the water elevation (called 'stage') to a streamflow ('discharge') by using a curve that relates the elevation to a set of actual discharge measurements. This is done because currently the technology is not available to measure the flow of the water accurately enough directly. From the USGS National Streamflow Information Program
What was the stream discharge prior to and during the flood events?
The data for the stream gauge along Boulder Creek 5 miles downstream of downtown Boulder is reported in daily averages. Take a look at the interactive plot below to see how patterns of discharge seen in these data?
Questions:
Optional Data Activity: Visualize Stream Discharge Data in R to Better Understand the 2013 Colorado Floods.
Impact: Flood
Definition: A flood is any time water inundates normally dry land.
Return Interval
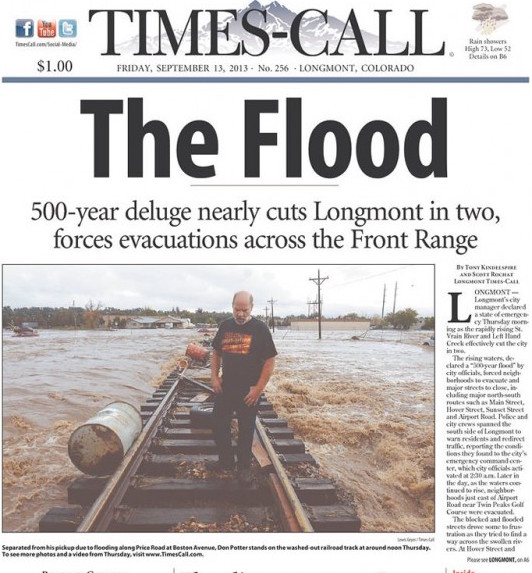
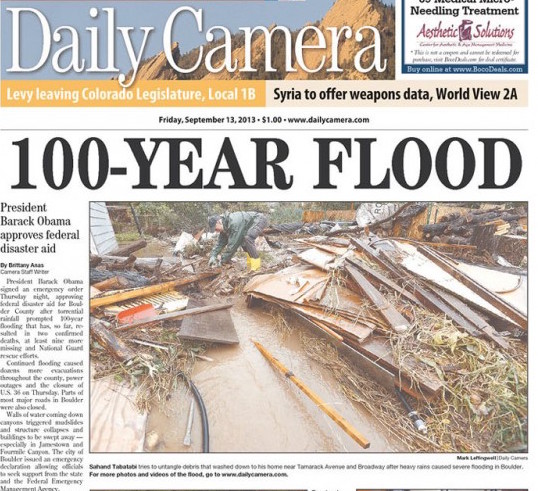
A 1000 year Flood!!! Understanding Return Periods
When talking about major disturbance events we often hear "It was a 1000-year flood" or "That was a 100-year storm". What does this really mean?
Definition: A return interval is the likelihood, a statistical measurement, of how often an event will occur for a given area.
Check out this video explanation from The Weather Channel on how return intervals are calculated and what they mean to us.
And it isn't just floods, major hurricanes are forecast to strike New Orleans, Louisiana once every 20 years. Yet in 2005 New Orleans was pummeled by 4 hurricanes and 1 tropical storm. Hurricane Cindy in July 2013 caused the worst black out in New Orleans for 40 years. Eight weeks later Hurricane Katrina came ashore over New Orleans, changed the landscape of the city and became the costliest natural disaster to date in the United States. It was frequently called a 100-year storm.
If we say the return period is 20 years then how did 4 hurricanes strike New Orleans in 1 year?
The return period of extreme events is also referred to as recurrence
interval. It is an estimate of the likelihood of an extreme event
based on the statistical analysis of data (including flood records, fire
frequency, historical climatic records) that an event of a given magnitude will
occur in a given year. The probability can be used to assess the risk of these
events for human populations but can also be used by biologists when creating
habitat management plans or conservation plans for endangered species. The
concept is based on the magnitude-frequency principle, where large magnitude
events (such as major hurricanes) are comparatively less frequent than smaller
magnitude incidents (such as rain showers). (For more information visit
Climatica's Return Periods of Extreme Events.)
Question
Your friend is thinking about buying a house near Boulder Creek. The house is above the level of seasonal high water but was flooded in the 2013 flood. He realizes how expensive flood insurance is and says, "Why do I have to buy this insurance, a flood like that won't happen for another 100 years? I won't live here any more." How would you explain to him that even though the flood was a 100-year flood he should still buy the flood insurance?
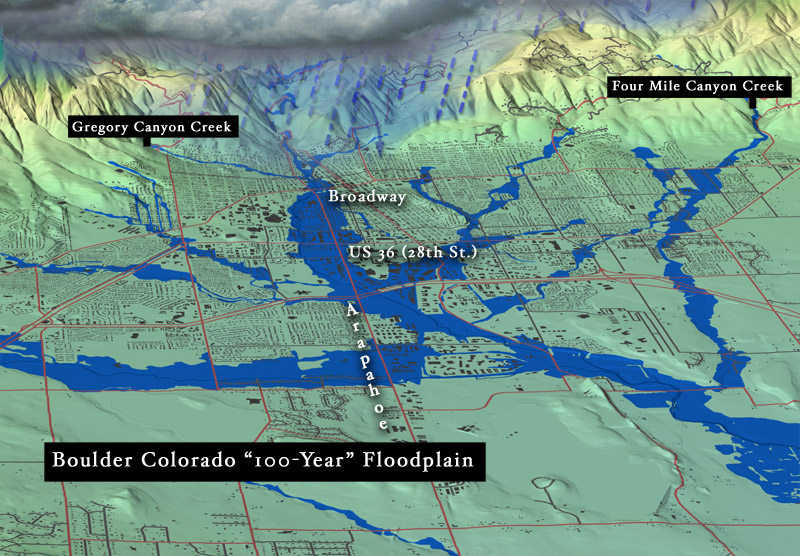
Flood Plains
Definition: A flood plain is land adjacent to a waterway, from the channel banks to the base of the enclosing valley walls, that experiences flooding during periods of high discharge.
Impact: Erosion & Sedimentation
How can we evaluate the impact of a flooding event?
1. Economic Impacts
We could look at economic damages to homes, businesses, and other infrastructure. Click here to view the City of Boulder's maps for flood damages.
2. Before & After Photos
We could view photos from before and after the disturbance event to see where erosion or sedimentation has occurred.
Images are great for an overall impression of what happened, where soil has eroded, and where soil or rocks have been deposited. But it is hard to get measurements of change from these 2D images. There are several ways that we can measure the apparent erosion and soil deposition.
3. Field Surveys
Standard surveys can be done to map the three-dimensional position of points allowing for measurement of distance between points and elevation. However, this requires extensive effort by land surveyors to visit each location and collect a large number of points to precisely map the region. This method can be very time intensive.
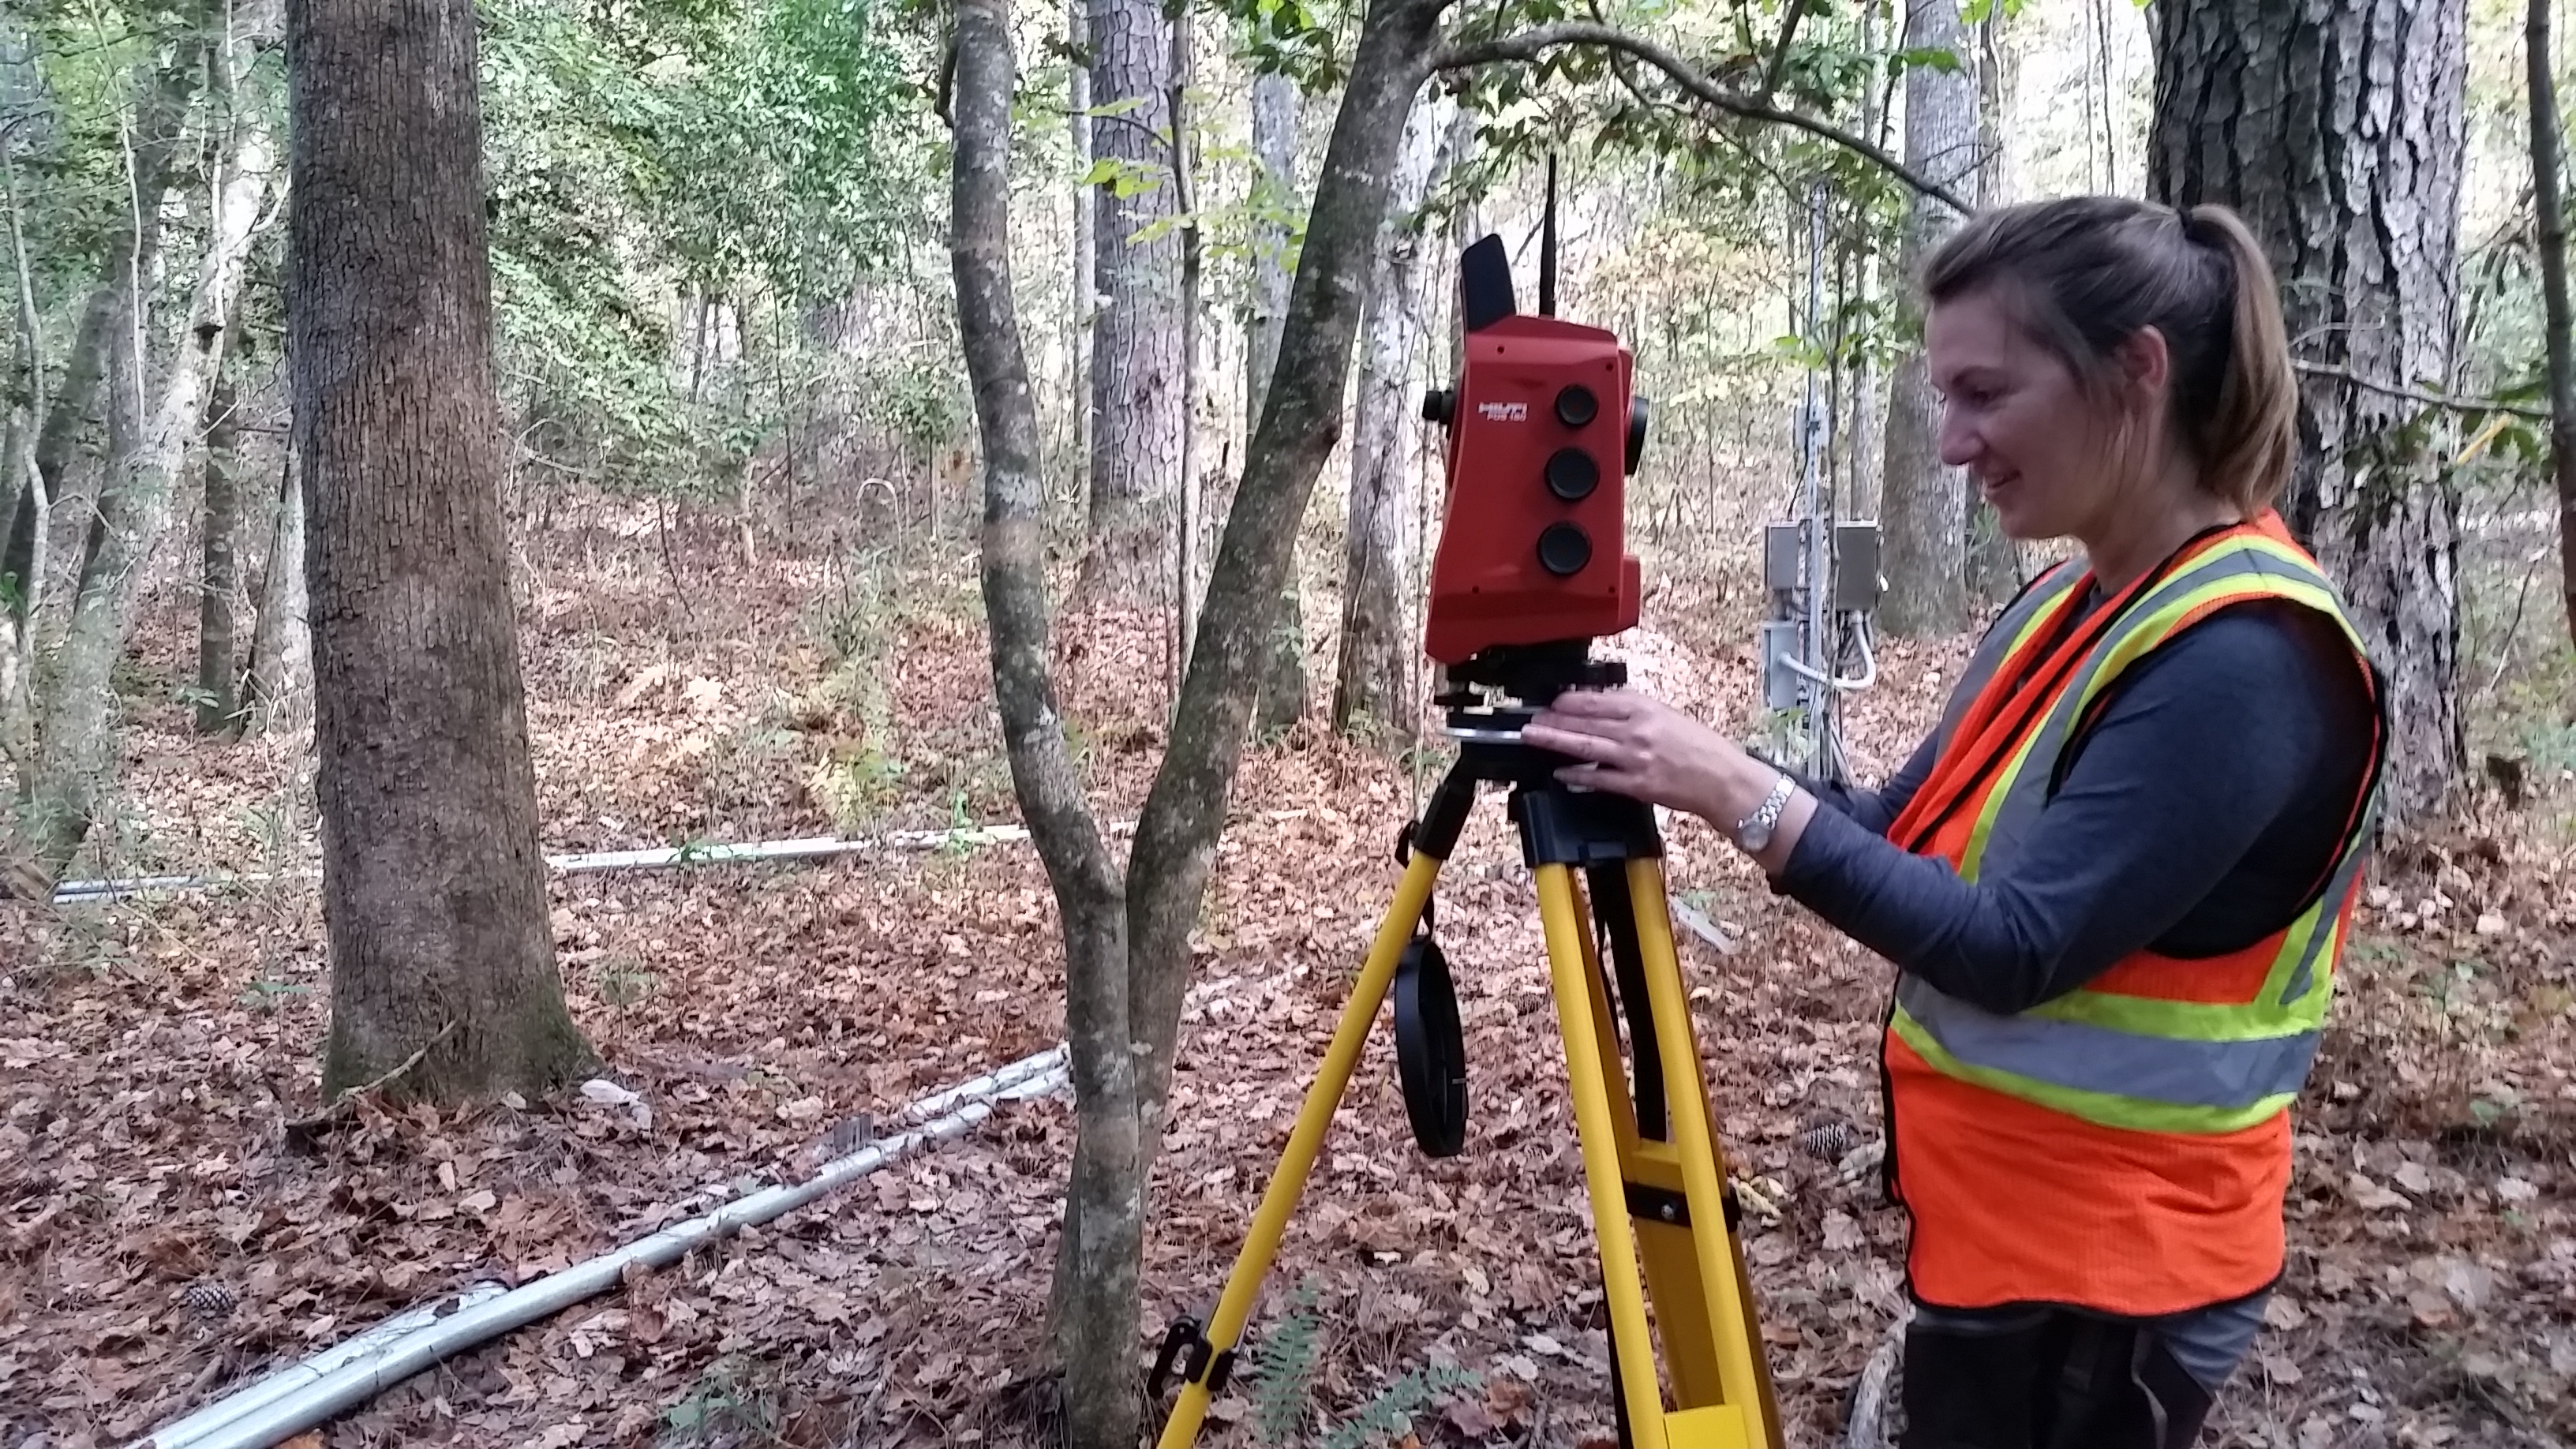
This method is challenging to use over a large spatial scale.
4. Stereoscopic Images
We could view stereoscopic images, two photos taken from slightly different perspectives to give the illusion of 3D, one can view, and even measure, elevation changes from 2D pictures.
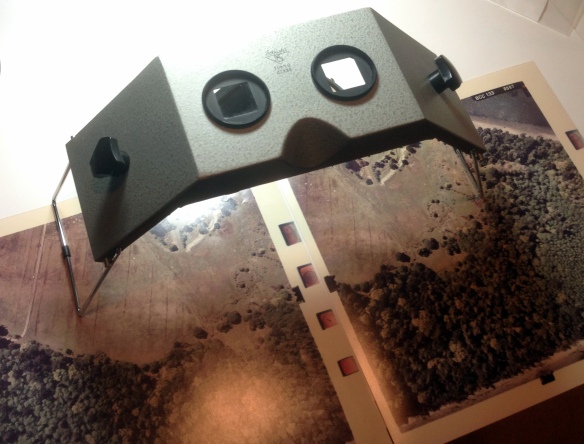
However, this relies on specialized equipment and is challenging to automate.
5. LiDAR
A newer technology is Light Detection and Ranging (LiDAR or lidar).
Watch this video to see how LiDAR works.
Using LiDAR to Measure Change
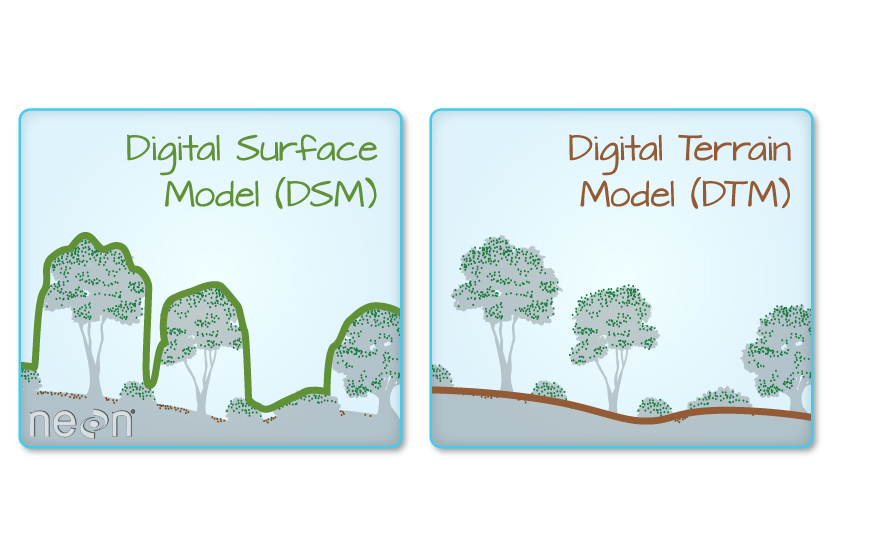
LiDAR data allows us to create models of the earth's surface. The general term for a model of the elevation of an area is a Digital Elevation Model (DEM). DEMs come in two common types:
- Digital Terrain Models (DTM): The elevation of the ground (terrain).
- Digital Surface Models (DSM): The elevation of everything on the surface of the earth, including trees, buildings, or other structures. Note: some DSMs have been post-processed to remove buildings and other human-made objects.
Digital Terrain Models (DTMs)

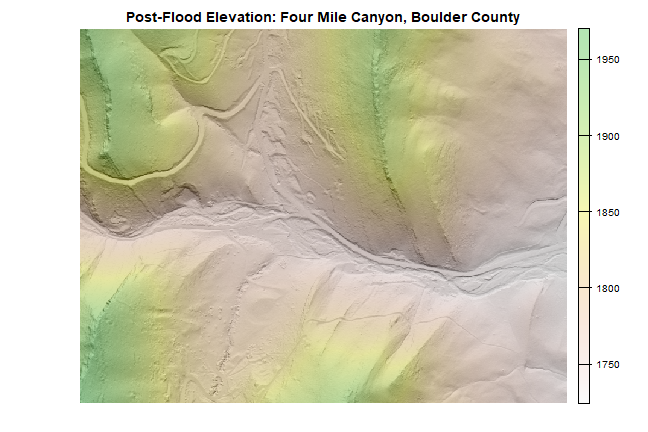
Here we have Digital Terrain Model of lower Four-Mile Canyon Creek from before the 2013 flood event (left) and from after the 2013 flood event (right). We can see some subtle differences in the elevation, especially along the stream bed, however, even on this map it is still challenging to see.
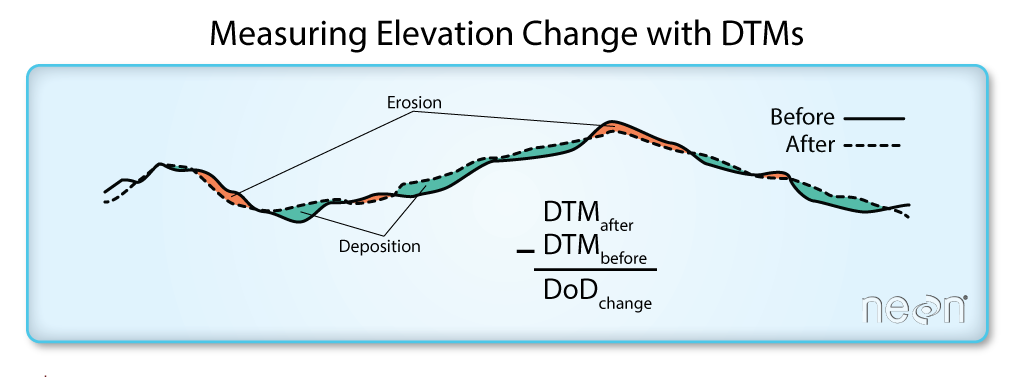
Digital Elevation Model of Difference (DoD)
If we have a DEM from before and after an event, we can can create a model that shows the change that occurred during the event. This new model is called a Digital Elevation Model of Difference (DoD).
Questions
Here we are using DTMs to create our Digital Elevation Model of Difference (DoD) to look at the changes after a flooding event. What types of disturbance events or what research question might one want to look at DoDs from Digital Surface Models?
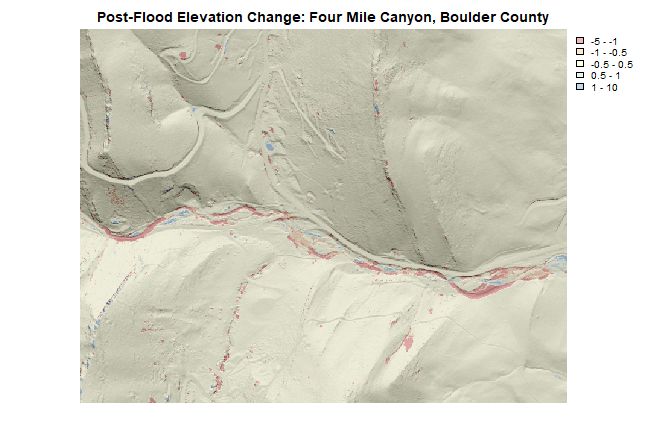
Four Mile Canyon Creek DoD
Optional Data Activity: Visualize Topography Change using LiDAR-derived Data in R to Better Understand the 2013 Colorado Floods.
Using Data to Understand Disturbance Events
We've used the data from drought, atmospheric conditions, precipitation, stream flow, and the digital elevation models to help us understand what caused the 2013 Boulder County, Colorado flooding event and where there was change in the stream bed around Four Mile Canyon Creek at the outskirts of Boulder, Colorado.
Quantifying the change that we can see from images of the flooding streams or post-flood changes to low lying areas allows scientists, city planners, and homeowners to make choices about future land use plans.
Follow-up Questions
- What other types of questions could this or similar data be used to answer?
- What types of disturbance events in your local area could you use data to quantify the causes and impact of?