Tutorial
The Basics of LiDAR - Light Detection and Ranging - Remote Sensing
Last Updated: Apr 2, 2026
LiDAR or Light Detection and Ranging is an active remote sensing system that can be used to measure vegetation height across wide areas. This page will introduce fundamental LiDAR (or lidar) concepts including:
- What LiDAR data are.
- The key attributes of LiDAR data.
- How LiDAR data are used to measure trees.
The Story of LiDAR
Key Concepts
Why LiDAR
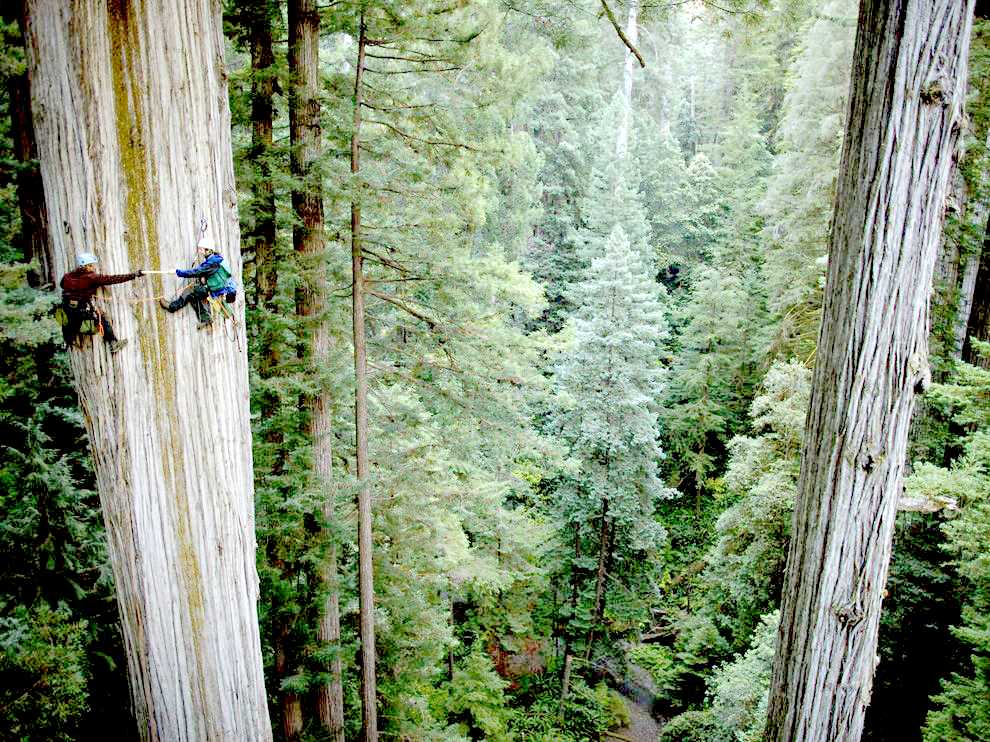
Scientists often need to characterize vegetation over large regions to answer research questions at the ecosystem or regional scale. Therefore, we need tools that can estimate key characteristics over large areas because we don’t have the resources to measure each and every tree or shrub.
Remote sensing means that we aren’t actually physically measuring things with our hands. We are using sensors which capture information about a landscape and record things that we can use to estimate conditions and characteristics. To measure vegetation or other data across large areas, we need remote sensing methods that can take many measurements quickly, using automated sensors.
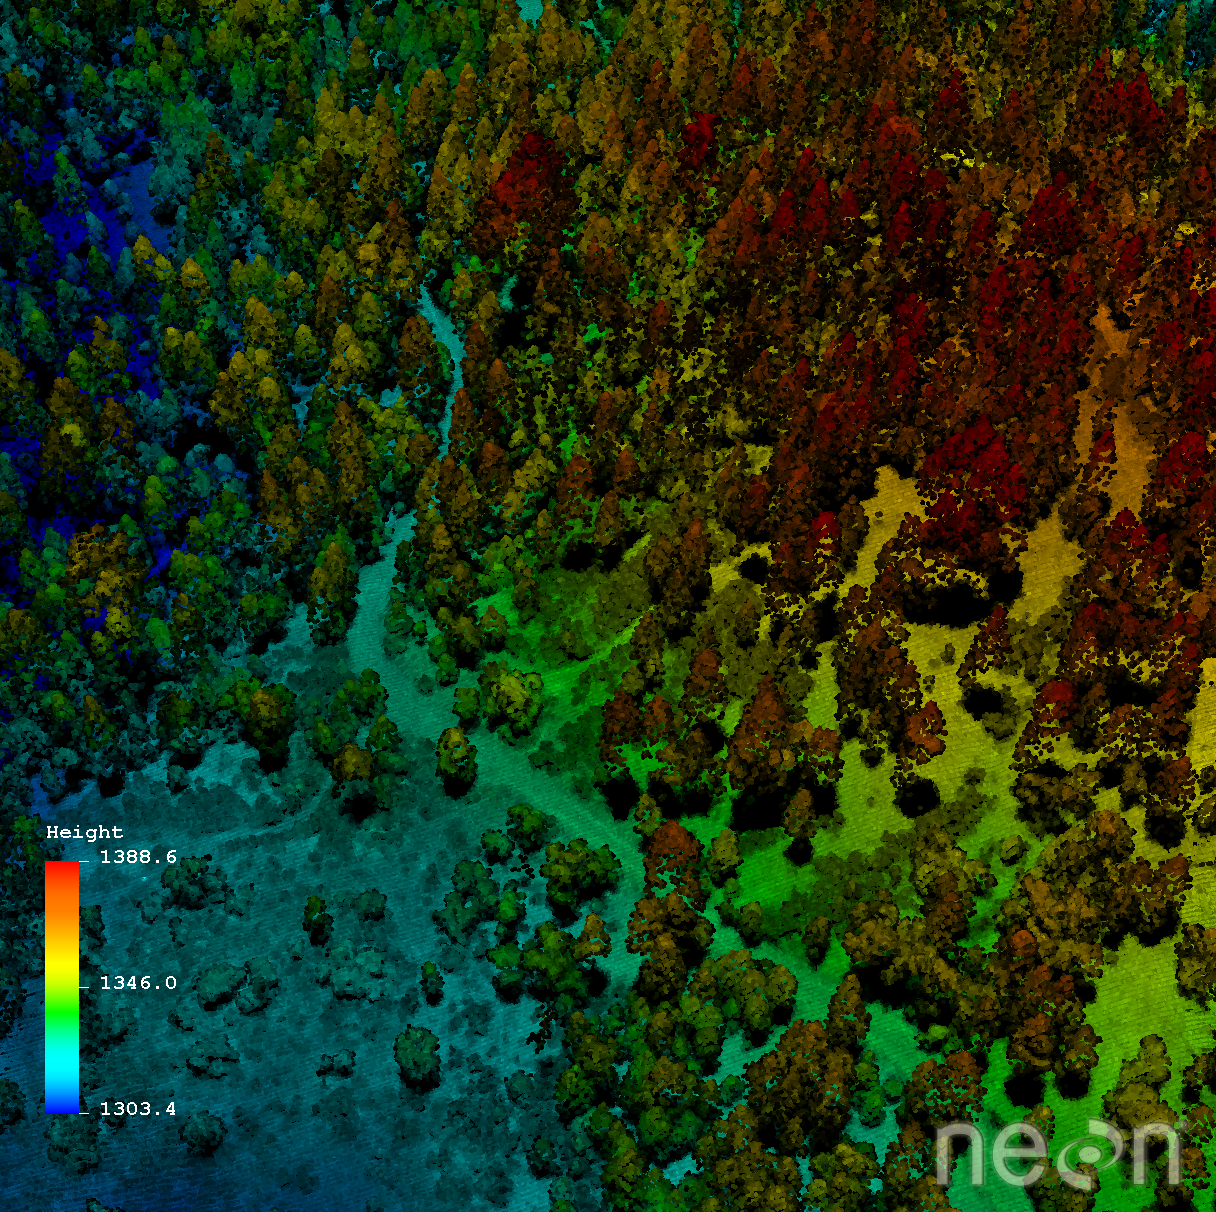
LiDAR, or Light Detection And Ranging (sometimes also referred to as active laser scanning) is one remote sensing method that can be used to map structure including vegetation height, density and other characteristics across a region. LiDAR directly measures the height and density of vegetation on the ground making it an ideal tool for scientists studying vegetation over large areas.
How LiDAR Works
How Does LiDAR Work?
LiDAR is an active remote sensing system. An active system means that the system itself generates energy - in this case, light - to measure things on the ground. In a LiDAR system, light is emitted from a rapidly firing laser. You can imagine light quickly strobing (or pulsing) from a laser light source. This light travels to the ground and reflects off of things like buildings and tree branches. The reflected light energy then returns to the LiDAR sensor where it is recorded.
A LiDAR system measures the time it takes for emitted light to travel to the ground and back, called the two-way travel time. That time is used to calculate distance traveled. Distance traveled is then converted to elevation. These measurements are made using the key components of a lidar system including a GPS that identifies the X,Y,Z location of the light energy and an Inertial Measurement Unit (IMU) that provides the orientation of the plane in the sky (roll, pitch, and yaw).
How Light Energy Is Used to Measure Trees
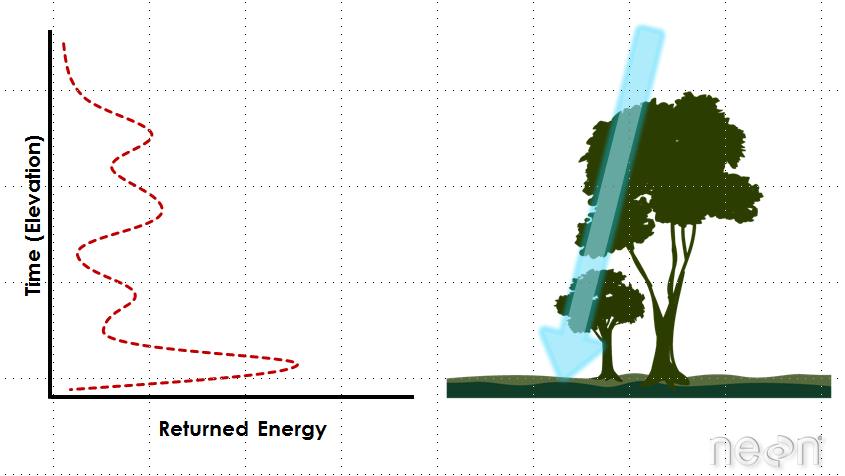
Light energy is a collection of photons. As photon that make up light moves towards the ground, they hit objects such as branches on a tree. Some of the light reflects off of those objects and returns to the sensor. If the object is small, and there are gaps surrounding it that allow light to pass through, some light continues down towards the ground. Because some photons reflect off of things like branches but others continue down towards the ground, multiple reflections (or "returns") may be recorded from one pulse of light.
LiDAR waveforms
The distribution of energy that returns to the sensor creates what we call a waveform. The amount of energy that returned to the LiDAR sensor is known as "intensity". The areas where more photons or more light energy returns to the sensor create peaks in the distribution of energy. Theses peaks in the waveform often represent objects on the ground like - a branch, a group of leaves or a building.
How Scientists Use LiDAR Data
There are many different uses for LiDAR data.
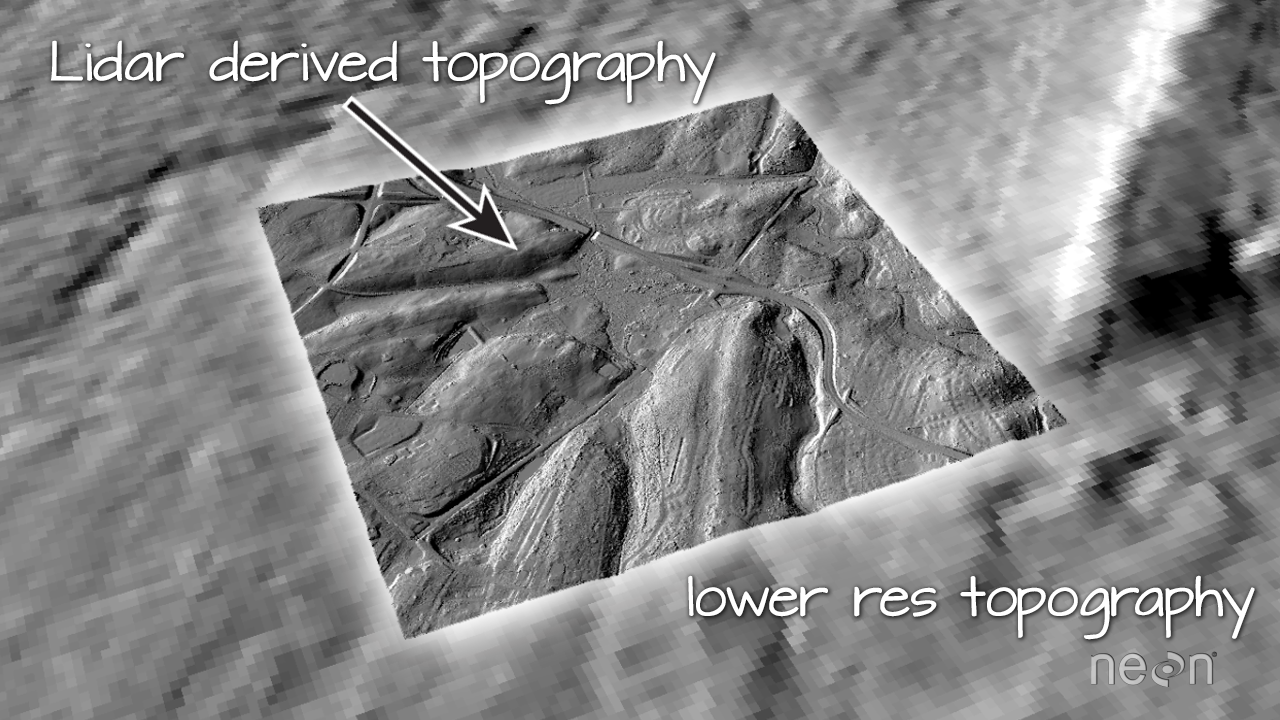
- LiDAR data classically have been used to derive high resolution elevation data models
- LiDAR data have also been used to derive information about vegetation structure including:
- Canopy Height
- Canopy Cover
- Leaf Area Index
- Vertical Forest Structure
- Species identification (if a less dense forests with high point density LiDAR)
Discrete vs. Full Waveform LiDAR
A waveform or distribution of light energy is what returns to the LiDAR sensor. However, this return may be recorded in two different ways.
- A Discrete Return LiDAR System records individual (discrete) points for the peaks in the waveform curve. Discrete return LiDAR systems identify peaks and record a point at each peak location in the waveform curve. These discrete or individual points are called returns. A discrete system may record 1-11+ returns from each laser pulse.
- A Full Waveform LiDAR System records a distribution of returned light energy. Full waveform LiDAR data are thus more complex to process, however they can often capture more information compared to discrete return LiDAR systems. One example research application for full waveform LiDAR data includes mapping or modelling the understory of a canopy.
LiDAR File Formats
Whether it is collected as discrete points or full waveform, most often LiDAR data are available as discrete points. A collection of discrete return LiDAR points is known as a LiDAR point cloud.
The commonly used file format to store LIDAR point cloud data is called ".las" which is a format supported by the American Society of Photogrammetry and Remote Sensing (ASPRS). Recently, the .laz format has been developed by Martin Isenberg of LasTools. The differences is that .laz is a highly compressed version of .las.
Data products derived from LiDAR point cloud data are often raster files that may be in GeoTIFF (.tif) formats.
LiDAR Data Attributes: X, Y, Z, Intensity and Classification
LiDAR data attributes can vary, depending upon how the data were collected and processed. You can determine what attributes are available for each lidar point by looking at the metadata. All lidar data points will have an associated X,Y location and Z (elevation) values. Most lidar data points will have an intensity value, representing the amount of light energy recorded by the sensor.
Some LiDAR data will also be "classified" -- not top secret, but with specifications about what the data represent. Classification of LiDAR point clouds is an additional processing step. Classification simply represents the type of object that the laser return reflected off of. So if the light energy reflected off of a tree, it might be classified as "vegetation" point. And if it reflected off of the ground, it might be classified as "ground" point.
Some LiDAR products will be classified as "ground/non-ground". Some datasets will be further processed to determine which points reflected off of buildings and other infrastructure. Some LiDAR data will be classified according to the vegetation type.
Exploring 3D LiDAR data in a free Online Viewer
Check out our tutorial on viewing LiDAR point cloud data using the Plas.io online viewer: Plas.io: Free Online Data Viz to Explore LiDAR Data. The Plas.io viewer used in this tutorial was developed by Martin Isenberg of Las Tools and his colleagues.
Summary
- A LiDAR system uses a laser, a GPS and an IMU to estimate the heights of objects on the ground.
- Discrete LiDAR data are generated from waveforms -- each point represent peak energy points along the returned energy.
- Discrete LiDAR points contain an x, y and z value. The z value is what is used to generate height.
- LiDAR data can be used to estimate tree height and even canopy cover using various methods.
Additional Resources
- What is the LAS format?
- Using .las with Python? las: python ingest
- Specifications for las v1.3