Research Highlight
Modeling the Spread of Ticks—And the Diseases They Carry
May 27, 2020
Tick populations are on the move in the U.S. The lone star tick (Amblyomma americanum) is expanding its range westward into the Great Plains. Deer ticks (Ixodes scapularis), American dog ticks (Dermacentor variabilis), and Gulf Coast ticks (Amblyomma maculatum) are migrating north into the Upper Midwest and Northeast. With them, they bring an array of tick-borne diseases such as Lyme disease, Rocky Mountain Spotted Fever, ehrlichiosis, anaplasmosis, and tularemia.
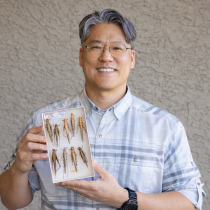
Understanding why tick populations are increasing, and why some species are spreading into new geographic areas, is of critical importance to public health. However, the environmental drivers behind tick abundance, range, and diversity are not yet well understood. Two researchers from the University of Florida (UF), Samantha Wisely and Geraldine Klarenberg, are working to change that. Their study, “Evaluation of NEON Data to Model Spatio-Temporal Tick Dynamics in Florida,” used NEON data to develop a model of tick population dynamics at the Ordway Swisher Biological Station (OSBS) field site.
Building a Model of Tick Population Dynamics
Samantha Wisely is a professor in the UF Department of Wildlife Ecology and Conservation. Geraldine Klarenberg is a lecturer in Quantitative Data Science in the UF School of Forest Resources and Conservation. Together, they are building a model that simulates how landscape features, climate, and other environmental variables influence tick abundance and diversity in space and over time. Eventually, their model could be used to provide better predictions for how tick populations are growing and spreading.
Samantha says, “We’re seeing tick species in places where they have never been seen before. We need to understand the environmental drivers. We can speculate that changes in climate may be facilitating the spread of some species northward, for example, but we don’t know exactly what environmental conditions are driving the population changes.”
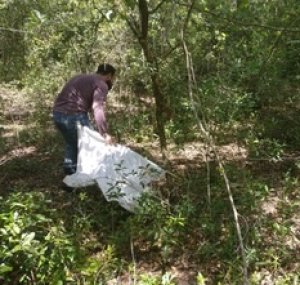
Their study used five years of NEON data from OSBS to build a model of tick abundance across the site. The model correlates tick abundance to a variety of other NEON data products, including precipitation, humidity, temperature, woody plant vegetation structure, herbaceous vegetation, plant biodiversity, and non-vegetative cover (e.g., leaf litter, woody organic material, soil and standing dead material). The goal was to determine how these variables are correlated with the number and type of ticks found during drag-cloth sampling. The NEON program collects tick sampling data at OSBS roughly every three weeks from March through September/October, so researchers can look at how tick counts vary across both space and time at the site.
Tick populations were found to be increasing across most sampling plots at OSBS. The conditions most closely associated with increases in tick abundance were plant biodiversity (the number of different plant species present on a plot), the amount of organic litter covering the ground, and the amount of woody organic material. Geraldine says, “These results are not surprising, but it is great that we are able to show the relationships in the model using the NEON data. This gives us confidence that we can extend this model to look at tick population dynamics in other areas.”
The model was able to successfully simulate tick populations at OSBS. Estimates derived by the model showed a high degree of agreement with actual observed tick counts at each plot over the course of the sampling season. The goal is to eventually create a predictive model that will allow researchers and public policy makers to predict how the populations of different tick species are changing across both time and space in a variety of ecosystems and habitats.
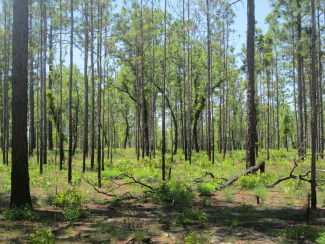
Forest at OSBS
The Importance of Large-Scale Networks for Studying Tick Ecology
The availability of consistent, reliable long-term data is essential to developing these kinds of models. While tick data has long been collected by the Centers for Disease Control and Prevention (CDC) and individual researchers, these studies tend to be limited in both the geographic area they cover and the length of time they are conducted. Because of differences in study design, it can be difficult to compare data from studies conducted by different researchers to get a clear picture of ecological differences between geographic regions or across time.
Large observatory networks like the NEON program generate enormous amounts of data that can be used by other researchers to explore ecological questions that can’t be easily addressed in limited-scope individual studies. The NEON program will collect data using the same methods at each field site for its entire 30-year duration. This allows data to be easily compared across large geographic and temporal scales, so researchers can get a better picture of ecological trends and the variables that are driving them. This scientific design was a key reason that Geraldine and Samantha opted to use NEON data to build their model.
Geraldine says, “Ecology and the environment are incredibly complex in several dimensions over both space and time. Initiatives [like the NEON program] are incredibly important, because we as humans have a hard time collecting enough data to see what is changing over time around us. NEON is trying to address this complexity by providing long-term ecological data on a continental scale. It’s really great to have this data set.”
Predicting the Spread of Tick-Borne Diseases
Samantha and Geraldine hope to extend their model beyond OSBS to look at tick populations and environmental drivers at other NEON sites. Additional data will enable them to compare results across different types of ecosystems and build a more robust model of how tick populations are changing over time in different regions.
This work is important because the spread of ticks goes hand-in-hand with an increase in the prevalence of tick-borne diseases across the U.S. In 2018, the CDC sent a report to Congress raising the alarm about the increases in tick-borne diseases such as Lyme disease, which infects an estimated 300,000 – 400,000 people each year and results in more than $1.3 billion in direct medical costs annually. Lyme disease cases have skyrocketed by more than 250% in the north-central states and more than 300% in the northeastern U.S. The disease continues to move into new areas where it had not previously been recorded. Other tick-borne diseases are also on the rise and spreading into new geographic regions.
The current model did not incorporate pathogen status data, but the team hopes to use NEON pathogen data in future studies. The NEON program tests different species of ticks for a wide range of different pathogens including disease-causing genera Anaplasma (anaplasmisis), Babesia (babesiosis), Borrelia (Lyme disease), Ehrlichia (monocytic ehrlichosis), Francisella (tularemia), and Rickettsia (Rocky Mountain Spotted Fever). Starting in 2020, NEON is also testing rodents for tick-borne pathogens as part of the Rodent-borne Pathogen Status data product. Tick data and related pathogen data are openly available through the NEON data portal.
Samantha’s interest in tick-borne diseases stems from ongoing research she is conducting at the University of Florida as part of the CDC Southeastern Center of Excellence in Vector Borne Diseases. As a wildlife ecologist, she is interested in how wildlife diseases impact humans, livestock and other wildlife.
Understanding how and why ticks are spreading will help to inform better public health policy for disease detection and prevention. Insights into environmental variables that influence their spread may also lead to better land management practices for tick control. Samantha says, “We can’t turn climate around immediately, but we can change habitat. Perhaps we can burn more frequently to eliminate woody debris on the ground or use other control measures to minimize the chances that people will come in contact with ticks. When we understand the drivers of tick abundance, we may be able to better manage it and let the public know.”