NSF NEON, Operated by Battelle

Main navigation

  • About
    • NEON Overview
      • Vision and Management
      • Spatial and Temporal Design
      • History
    • About the NEON Biorepository
      • ASU Biorepository Staff
      • Contact the NEON Biorepository
    • Observatory Blog
    • Newsletters
    • Staff
    • FAQ
    • Contact Us

    About

  • Data
    • Data Portal
      • Data Availability Charts
      • API & GraphQL
      • Prototype Data
      • Externally Hosted Data
    • Data Collection Methods
      • Airborne Observation Platform (AOP)
      • Instrument System (IS)
        • Instrumented Collection Types
        • Aquatic Instrument System (AIS)
        • Terrestrial Instrument System (TIS)
      • Observational System (OS)
        • Observation Types
        • Observational Sampling Design
        • Sampling Schedules
        • Taxonomic Lists Used by Field Staff
        • Optimizing the Observational Sampling Designs
      • Protocols & Standardized Methods
    • Getting Started with NEON Data
      • neonUtilities for R and Python
      • Learning Hub
      • Code Hub
    • Using Data
      • Data Formats and Conventions
      • Released, Provisional, and Revised Data
      • Data Product Bundles
      • Usage Policies
      • Acknowledging and Citing NEON
      • Publishing Research Outputs
    • Data Notifications
    • NEON Data Management
      • Data Availability
      • Data Processing
      • Data Quality

    Data

  • Samples & Specimens
    • Biorepository Sample Portal at ASU
    • About Samples
      • Sample Types
      • Sample Repositories
      • Megapit and Distributed Initial Characterization Soil Archives
    • Finding and Accessing Sample Data
      • Species Checklists
      • Sample Explorer - Relationships and Data
      • Biorepository API
    • Requesting and Using Samples
      • Loans & Archival Requests
      • Usage Policies

    Samples & Specimens

  • Field Sites
    • Field Site Map and Info
    • Spatial Layers & Printable Maps

    Field Sites

  • Resources
    • Getting Started with NEON Data
    • Research Support Services
      • Field Site Coordination
      • Letters of Support
      • Mobile Deployment Platforms
      • Permits and Permissions
      • AOP Flight Campaigns
      • Research Support FAQs
      • Research Support Projects
    • Code Hub
      • neonUtilities for R and Python
      • Code Resources Guidelines
      • Code Resources Submission
      • NEON's GitHub Organization Homepage
    • Learning Hub
      • Tutorials
      • Workshops & Courses
      • Science Videos
      • Teaching Modules
    • Science Seminars and Data Skills Webinars
    • Document Library
    • Funding Opportunities

    Resources

  • Impact
    • Research Highlights
    • Papers & Publications
    • NEON in the News

    Impact

  • Get Involved
    • Upcoming Events
    • Research and Collaborations
      • Environmental Data Science Innovation and Inclusion Lab
      • Collaboration with DOE BER User Facilities and Programs
      • EFI-NEON Ecological Forecasting Challenge
      • NEON Great Lakes User Group
      • NCAR-NEON-Community Collaborations
    • Advisory Groups
      • Science, Technology & Education Advisory Committee
      • Technical Working Groups
    • NEON Ambassador Program
      • Exploring NEON-Derived Data Products Workshop Series
    • Partnerships
    • Community Engagement
    • Work Opportunities

    Get Involved

  • My Account
  • Search

Search

Welcome to the updated NEON website! This site features more intuitive navigation and a seamlessly integrated Biorepository portal, making it easier to explore NEON data, samples and resources. For a brief summary of changes visit this page. Your feedback is welcome through our webform through February 20.

Breadcrumb

  1. NEON Data Science Challenge: Identifying Trees Using Remote Sensing Data

NEON Data Science Challenge: Identifying Trees Using Remote Sensing Data

Canopy at HARV site

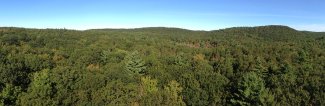
The view of Harvard Forest from the top of NEON's HARV meteorological/flux tower. Massachusetts.

December 2017

What’s the fastest way to count and identify individual trees in a landscape? Using remote sensing data and advanced analytics could help researchers gain new insights into how patterns in tree coverage and growth are changing over time. A team at the University of Florida is challenging the data science community to leverage NEON’s remote sensing data in the NIST-DSE Plant Identification with NEON Remote Sensing Data Challenge.

The challenge is sponsored by the National Institute of Standards and Technology (NIST) Data Science Evaluation (DSE) Series and the Gordon and Betty Moore Foundation’s Data-Driven Discovery Initiative. It was organized by the Data Science Research lab, the WEecology lab, and Stephanie Bohlman’s lab at the University of Florida in active collaboration with NEON. The competition is made possible because of NEON’s airborne data, which is openly available to all researchers.

Participants will utilize data gathered from NEON’s Airborne Observation Platforms. Using sophisticated sensors mounted on low-flying aircraft, NEON collects numerous physical, biological and biochemical data points during annual flights over NEON field sites. The competition challenges data scientists to use this data to accurately classify, measure, and count trees on the ground.

The data points available to contest entrants include:

  • Airborne remote sensing: High-resolution hyperspectral imagery, high tecoloresolution RGB imagery, and LiDAR data on plant height.
  • Ground Data: Ground-based measurements of tree size, location and type.
  • Individual Tree Crowns: Ground-based identification of tree crowns on remote sensing imagery.

Using this data, entrants will need to perform the following tasks:

  • Crown Delineation: Estimate the size, shape and location of individual tree crowns.
  • Alignment: Pair trees measured on the ground with those identified in remote sensing.
  • Classification: Determine the species identity of each tree from remotely sensed data.

Using remote sensing data and data science methods could significantly reduce the time and costs of ecological research related to tree growth, range and biodiversity. Traditional on-the-ground observational data collection is time consuming and expensive, requiring extensive time and labor in the field. Remote sensing data could enable faster data collection and studies of much larger areas than are possible through field studies. However, in order to be useful, the data must be able to be used to accurately determine species, size, and location. The data science challenge uses both field-based and remote sensing data in order to validate the methods used to interpret the data from the airborne remote sensing platforms and demonstrate their utility to answer key research questions.

The competition is open to all, and can be entered by either individuals or teams. More information on the NIST-DSE Plant Identification with NEON Remote Sensing Data challenge can be found at www.ecodse.org. Entries must be received by December 15.

This year’s data science challenge is a pilot. The University of Florida team plans to work with NEON to run an expanded version of the challenge in 2018.

Related Content

Putting NEON Assets to Use for the Research Community
NEON and LTER Share Space and Data in Pacific Northwest
NEON and Texas A&M Consider Collaboration for Flux Data
NEON Construction on Track for 90% Completion by End of Year
Featured Expert: Dr. Stefan Metzger
NSF NEON, Operated by Battelle

Follow Us:

Join Our Newsletter

Get updates on events, opportunities, and how NEON is being used today.

Subscribe Now

Footer

  • About Us
  • Contact Us
  • Terms & Conditions
  • Careers
  • Code of Conduct

Copyright © Battelle, 2026

The National Ecological Observatory Network is a major facility fully funded by the U.S. National Science Foundation.

Any opinions, findings and conclusions or recommendations expressed in this material do not necessarily reflect the views of the U.S. National Science Foundation.