Research Highlight
Soil Moisture Validation Project Highlights Synergies Between Battelle, NASA Programs
December 4, 2020
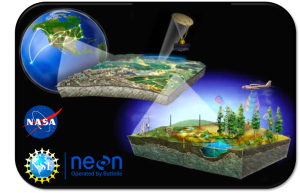
NASA monitors soil moisture levels and freeze/thaw conditions across the globe using a satellite orbiting 426 miles (685 km) above the Earth. To help validate and calibrate these satellite data, NASA relies on direct measurements taken by partners on the ground. Through a new collaboration with Battelle, soil moisture data collected at the National Ecological Observatory Network (NEON) field sites will now be part of those validation efforts.
The NASA SMAP Mission: Mapping Soil Moisture Across the Globe
The validation project will support NASA’s Soil Moisture Active Passive (SMAP) mission, which launched in January 2015 and is a joint effort of NASA’s Jet Propulsion Laboratory (JPL) and Goddard Space Flight Center (GSFC). SMAP measures the amount of water in surface soils (the top 5 cm on average) using a radiometer mounted to a satellite orbiting the Earth. (The satellite was also equipped with a radar system, which failed after 2½ months in orbit.) The orbital pattern enables collection of data every two to three days from every area of the globe. These data are translated into soil moisture estimates for every area not covered with water, snow or ice. SMAP produces maps that show how soil moisture levels and freeze/thaw state are changing over time, both seasonally and over extended time periods. SMAP’s remote sensing data have a large footprint, averaging soil moisture levels over areas roughly 36 km on a side (~1,300 km2).
Soil moisture is considered to be a key ecological indicator. Moisture levels in topsoil impact agricultural and ecosystem productivity. Understanding how moisture levels are changing over time also will provide important insights into how water, energy and carbon are exchanged in terrestrial ecosystems. This understanding could be used to improve weather forecasts and climate models. Ultimately, this could lead to improved flood forecasts and drought monitoring and help scientists predict how climate change might impact food productivity and water availability for different regions of the world.
Mahesh Pun, a Research Scientist for NASA/SSAI at Goddard, says, “Soil moisture is a really important parameter because it’s related to so many different fields of science—hydrology, ecology, agriculture, climate analysis, analysis of water resources, flood and drought prediction, and more. Having a really good grasp of soil moisture and how it is changing in different parts of the world touches on so many other things.”
Ground Truthing SMAP with NEON Soil Moisture Data
NASA relies on data collected on the ground to validate and calibrate the SMAP remote sensing data—a process known as “ground-truthing” or “ground validation” (GV). In situ soil moisture measurements (direct measurements taken in the environment) are compared to the SMAP satellite data. NASA currently has 15 Core Validation Sites (CVS) sites around the world, which collect robust soil moisture data across a broad footprint similar in scale to the SMAP footprint. The CVS are augmented by a more extensive “sparse network”: 400+ sites that collect point data on soil moisture levels. These sites do not collect data on the large scales needed to map to an entire SMAP footprint, but they do enable comparisons with ground data representing a broader selection of global regions and ecosystem types. Both the CVS and the sparse network sites are essential for SMAP calibration and validation (CV) efforts.
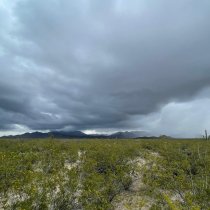
The internally-funded Battelle project will help to permanently incorporate NEON field sites into the SMAP sparse validation network. The NEON program, managed by Battelle and funded by the National Science Foundation (NSF), is a continental-scale ecological observatory that collects a broad range of data products at field sites located in 20 ecoclimatic zones across the U.S., including Hawaii, Alaska and Puerto Rico. Soil moisture data is collected with in situ instruments at 47 terrestrial field sites.
The collaboration project reached its first milestone in August of 2020 by successfully ingesting soil moisture data from the NEON Jornada (JORN) site in New Mexico. Melissa Genazzio, the Battelle Program Manager for the project, says, “Jornada was a good candidate due to its overall low precipitation, scrub/shrub grassland ecosystem and predictable monsoon season, which results in large variations in soil moisture over a short time period.” Comparison of data from 2019 to the present showed a significant overlap between SMAP and JORN data, suggesting that the NEON field site data will be usable for SMAP CV efforts. Moving forward, the teams are conducting data analysis in preparation for ingesting data from additional NEON field sites into the SMAP CV program.
Into the Woods at NEON Forested Field Sites
The Battelle collaboration, which will eventually incorporate soil moisture data from all 47 NEON terrestrial field sites, will provide a valuable addition to the SMAP CV program. Adding the NEON sites provides coverage for a broader range of landscapes across the continent.
The NEON program is a 30-year ecology program that collects the same data products in the same way at all of its field sites. Data are then made freely and publicly available to the research community through the NEON Data Portal. These attributes make the NEON data products highly beneficial for projects like the SMAP CV program, which rely on high-quality data that are comparable across both space and time. Soil moisture data are collected at five dispersed ground plots at most NEON field sites, which allows researchers to average the results and reduce the impact of random local variation.
Adding the NEON field sites also fills an important data hole for the SMAP CV program. Currently, most of the core and sparse network validation sites represent agricultural areas and grasslands. The NEON field sites include a number of forested sites, which have been underrepresented in the SMAP CV data. Twenty-six of the NEON terrestrial field sites are forested, expanding the number of forested sites in the CV program fivefold. Soil moisture measurement using remote sensing is more challenging in forested areas due to the way the forest canopy interacts with radiation. Adding the NEON forested field sites to the SMAP validation network could help to improve soil moisture observations in forested ecosystems.

Beyond SMAP: Making Connections Between Earth and Space
The SMAP CV project is just one example of how data products from the NEON project can be used to augment and validate data from other large-scale research programs. NASA collects a variety of other satellite data products, including temperature, precipitation, carbon and energy fluxes, and hyperspectral data (which can be used to infer vegetation composition and productivity, among other variables). Similar data are collected at NEON field sites through ground observations and in situ sensors, flux tower measurements, and the NEON Airborne Observation Platforms.
Ed Ayres, who oversees the soil sensor instruments for the NEON program, says, “The data that we collect at NEON serve a number of purposes. In addition to providing a direct window into what is happening in different ecosystems, we can also serve as a testbed for other major projects. No one predicted that we would be supporting NASA satellite programs and helping them improve data quality for their sensors. The data that we are collecting have more uses than are immediately apparent.”
Josh Roberti, a Data Scientist for the NEON program, adds, “These types of collaborations are important because they introduce opportunities for each network to validate data at different spatiotemporal scales. Ultimately, this leads to improved data quality and forecasting models that benefit the science community at large.”