Research Highlight
Mapping Tree Mortality in the Pacific Southwest
May 20, 2020

First, an extended drought weakened them. Then, an explosion of pine beetles finished them off. This one-two punch resulted in the deaths of more than 129 million trees in California between 2010 and 2017.
A team led by David Hulslander and Jessica Bolis, both NEON scientists, has developed a method to map tree mortality with an unprecedented level of detail using hyperspectral remote sensing data from the NEON Airborne Observational Platform (AOP) and a novel imaging algorithm. Initially used to map the locations of individual standing dead trees at the NEON Soaproot Saddle (SOAP) terrestrial field site in the Sierra Nevada Mountains, the method could be applied to a range of imaging challenges, from assessing the vulnerability of living forests to detecting illegal logging activity.
An Ecological Disaster in Southern California
Drought and bark beetle infestations both have a long history in California. The climate in the Pacific Southwest is characterized by periodic cycles of drought. Native bark beetles take advantage of drought conditions to feast on weakened trees.
However, climate change has intensified the severity and duration of these droughts over the last several decades. The most recent drought, from 2012-2017, was the most severe on record as measured by the Palmer Drought Severity Index (PDSI). Over the course of the drought, more than 7.6 million acres were impacted by severe tree die off events, resulting in the deaths of more than 129 million trees across the state.
Several trends have come together in California over recent decades that increase the likelihood of these devastating mass tree mortality episodes.
- Precipitation patterns have become more variable, resulting in an increase in both drought severity and duration on one hand and the frequency of heavy precipitation events and flooding on the other.
- Higher average temperatures result in less snowpack at higher elevations, reducing an important source of moisture for the watershed during the spring growing season.
- Higher temperatures also result in increased evaporation of surface water and increased transpiration (release of water vapor by plants), leading to further water shortages and increased stress on plants.
- Higher winter temperatures allow bark beetles to thrive and reproduce for a longer season and at higher elevations, extending their range and supporting a population explosion.
- Trees already stressed by drought conditions are more vulnerable to bark beetle infestations and less able to bounce back from the damage caused by the insects. Insect population growth is further amplified by their success in exploiting the weakened trees.
- Many of California's forests are dominated by single species of trees packed closely together, such as the ponderosa pine forests of the Sierra Nevada. This allows beetle infestations to spread quickly.
Together, these factors create ideal conditions for mass tree mortality. The loss of the dominant canopy trees in a region causes ripple effects through the rest of the ecosystem, changing the composition of the vegetation that springs up to replace them and impacting the insect, bird, mammal and microbe populations that depend on them. Large stands of dead and dying trees also create the perfect fuel for wildfires.
Mapping the Danger Zones at Soaproot Saddle
The NEON Soaproot Saddle (SOAP) field site is located on the western slope of the Sierra Nevada mountain range, in the Sierra National Forest. This is at the center of one of the areas most impacted by the 2012-2017 California tree die off. NEON’s initial airborne remote sensing flight survey over SOAP was in 2013, just before major die offs began. More recent runs, from 2017 though 2019, provide a picture of a dramatically changed landscape. More than 95% of the ponderosa pines, the dominant canopy tree in the southern and central Sierras, have died since the initial run.
The NEON field science team working at SOAP has been tracking the changes in vegetation structure and composition, along with other ecosystem variables, since 2014. Jessica Bolis, the Field Manager for NEON's Pacific Southwest domain, says, "When we did the initial vegetation characterization in 2014, nearly 75% of the pines were showing signs of beetle infestation. Now, we aren't seeing any left alive."
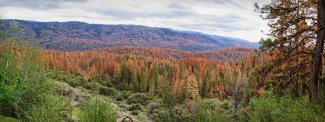
Canopy at the terrestrial SOAP site
The massive die off has created dangerous conditions for field crews. Large dead trees—sometimes called "widow makers"—are located throughout SOAP, in and around field observation plots and along the routes field researchers take to access them. Some plots are now considered too dangerous to access at all. Jessica and her team needed a better understanding of the risks of tree fall in and around the observation plots. "I don't want to send my team into an area where large, heavy dead trees are still left standing. These trees could fall at any time," she explains.
Jessica partnered with the NEON AOP team to quantify the risks at different locations within the site. Using remote sensing data, researchers were able to locate individual dead trees and create "heat maps" of SOAP that show where the risk of falling trees is greatest.
New Mapping Methods Using Hyperspectral Imaging and LiDAR
The mapping effort was led jointly by Jessica Bolis and David Hulslander, the Principal Research Scientist for the NEON Imaging Spectrometer (NIS) on the NEON AOP team.
The imaging spectrometer is one of the instruments carried by the AOPs. It is a hyperspectral imager that gathers data from both the human visible light range and the infrared and near-infrared ranges. Custom designed and built by NASA’s Jet Propulsion Laboratory for the NEON program, it measures reflected light energy in 428 wavelengths extending from 380 to 2500 nm. At flight altitudes of 1000 m, it provides resolution of the ground and canopy of approximately 1 m. "This is a perfect problem for airborne remote sensing," David says. "We’re able to rapidly characterize landforms and vegetation structures over areas too large to cover by foot, at a very good resolution."
One of the data products created by the NIS is the Normalized Difference Vegetation Index (NDVI), a measure of how lush vegetation is. Green, chlorophyll-containing vegetation reflects light differently than dead or dying vegetation. By comparing the reflectance in both the red and near infrared wavelengths, researchers can determine the level of greenness in the landscape and assign a score from 1 to -1. A score of 1 indicates a lush, green landscape, 0 indicates dead vegetation, and a negative score indicates rocks or pavement. David's team created a map of dead vs. living vegetation across SOAP.
The next step was to distinguish fallen trees and low vegetation from still-standing trees, which present the highest risk for field researchers. David and his team used lidar (Light Detection And Ranging) data to create a high-resolution map of canopy height. By overlaying the lidar canopy map with the NDVI data, researchers were able to identify individual standing dead trees. A standing dead tree was defined as a data point where the canopy was 2 m or higher and the NDVI was lower than 0.5.
Using this method, the locations of several thousand still-standing dead trees were identified and a heat map was created showing the relative danger of tree fall across the site. Jessica’s team then verified the accuracy of the maps with field observations. Now, the NEON field team uses the maps to determine which areas are safe to access and plan the safest routes to observation plots.
The mapping methodology has other potential applications beyond mapping individual dead trees. David explains that similar techniques could be used to monitor large tracts of forest for illegal logging or other disturbances. Spectrometer data can also be used to measure other aspects of ecosystem health, such as biophysical properties of the forest canopy that could indicate high levels of stress.
Monitoring an Ecosystem in Recovery
The NEON team continues to collect observational, sensor and remote sensing data from SOAP. These data products will provide a picture of how the ecosystem is changing as it recovers from the drought.
Over the last two years, the U.S. Forest Service has cut down dead vegetation near roadways and conducted some controlled burns to clear out the understory. There are differing opinions on whether there should be any replanting of the lost ponderosa pines.
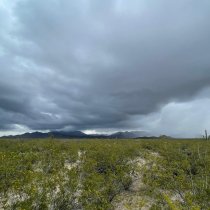
The landscape that is coming back on its own looks very different from the one that existed before the drought. Low shrubs such as Chamaebatia (also known as mountain misery or bear clover), tall stands of manzanita and poison oak have sprung up in areas once covered by tall pine forest. These plants are well adapted for the hot, open landscape left behind now that the forest canopy is gone. Jessica says, "It's hard to say how much of the forest will come back. This area may just become scrubland."
Over the next three decades, the NEON project will be monitoring these changes, along with other changes in the climate and ecosystem at SOAP. These open access data products will help researchers answer critical questions about how ecosystems recover after a mass tree mortality event and how changes in vegetation composition and structure impact carbon and nutrient cycling, land morphology, hydrology, temperature cycling, and insect, mammal and bird populations. Observing these changes at SOAP will provide insights into ecosystem change and recovery in the Sierra Nevada region and across the state.
The data collected at SOAP is organized into three categories: airborne remote sensing, automated instruments and observational sampling. All of the data are available to researchers and the public for free from the NEON Data Portal. Biological, genomic and geological samples are also collected and archived for researchers to request and study.