NSF NEON, Operated by Battelle

Main navigation

  • About
    • NEON Overview
      • Vision and Management
      • Spatial and Temporal Design
      • History
    • About the NEON Biorepository
      • ASU Biorepository Staff
      • Contact the NEON Biorepository
    • Observatory Blog
    • Newsletters
    • Staff
    • FAQ
    • Contact Us

    About

  • Data
    • Data Portal
      • Data Availability Charts
      • API & GraphQL
      • Prototype Data
      • Externally Hosted Data
    • Data Collection Methods
      • Airborne Observation Platform (AOP)
      • Instrument System (IS)
        • Instrumented Collection Types
        • Aquatic Instrument System (AIS)
        • Terrestrial Instrument System (TIS)
      • Observational System (OS)
        • Observation Types
        • Observational Sampling Design
        • Sampling Schedules
        • Taxonomic Lists Used by Field Staff
        • Optimizing the Observational Sampling Designs
      • Protocols & Standardized Methods
    • Getting Started with NEON Data
      • neonUtilities for R and Python
      • Learning Hub
      • Code Hub
    • Using Data
      • Data Formats and Conventions
      • Released, Provisional, and Revised Data
      • Data Product Bundles
      • Usage Policies
      • Acknowledging and Citing NEON
      • Publishing Research Outputs
    • Data Notifications
    • NEON Data Management
      • Data Availability
      • Data Processing
      • Data Quality

    Data

  • Samples & Specimens
    • Biorepository Sample Portal at ASU
    • About Samples
      • Sample Types
      • Sample Repositories
      • Megapit and Distributed Initial Characterization Soil Archives
    • Finding and Accessing Sample Data
      • Species Checklists
      • Sample Explorer - Relationships and Data
      • Biorepository API
    • Requesting and Using Samples
      • Loans & Archival Requests
      • Usage Policies

    Samples & Specimens

  • Field Sites
    • Field Site Map and Info
    • Spatial Layers & Printable Maps

    Field Sites

  • Resources
    • Getting Started with NEON Data
    • Research Support Services
      • Field Site Coordination
      • Letters of Support
      • Mobile Deployment Platforms
      • Permits and Permissions
      • AOP Flight Campaigns
      • Research Support FAQs
      • Research Support Projects
    • Code Hub
      • neonUtilities for R and Python
      • Code Resources Guidelines
      • Code Resources Submission
      • NEON's GitHub Organization Homepage
    • Learning Hub
      • Tutorials
      • Workshops & Courses
      • Science Videos
      • Teaching Modules
    • Science Seminars and Data Skills Webinars
    • Document Library
    • Funding Opportunities

    Resources

  • Impact
    • Research Highlights
    • Papers & Publications
    • NEON in the News

    Impact

  • Get Involved
    • Upcoming Events
    • Research and Collaborations
      • Environmental Data Science Innovation and Inclusion Lab
      • Collaboration with DOE BER User Facilities and Programs
      • EFI-NEON Ecological Forecasting Challenge
      • NEON Great Lakes User Group
      • NCAR-NEON-Community Collaborations
    • Advisory Groups
      • Science, Technology & Education Advisory Committee
      • Technical Working Groups
    • NEON Ambassador Program
      • Exploring NEON-Derived Data Products Workshop Series
    • Partnerships
    • Community Engagement
    • Work Opportunities

    Get Involved

  • My Account
  • Search

Search

About

  • NEON Overview
  • About the NEON Biorepository
  • Observatory Blog
  • Newsletters
  • Staff
  • FAQ
  • Contact Us

Breadcrumb

  1. About
  2. Observatory Blog
  3. Mapping the invisible: the power of spectral remote sensing

Mapping the invisible: the power of spectral remote sensing

July 14, 2015

Twin otter plane

The evolution of high-resolution cameras and image spectrometry is changing the landscape of ecology.

Different objects reflect, absorb and transmit light differently, including light that is visible or not visible to the human eye. Cameras and image spectrometers both measure reflected light energy to capture images. However, cameras record visible light in three bands that fall within the Red-Green-Blue (RGB) spectrum, while imaging spectrometers break the electromagnetic spectrum into many bands that support classification of objects on the earth’s surface by their spectral properties. When mounted on airplanes and satellites, these instruments help scientists measure changes to the earth’s surface over large areas.

This NEON Data Skills video was developed in collaboration with:

  • Kyla Dahlin, Michigan State University
  • Shawn Serbin, Brookhaven National Laboratory
  • Keely Roth, University of California, Davis post-doctoral scholar
  • Laura Chasmer, University of Lethbridge

Capturing changes in vegetation cover

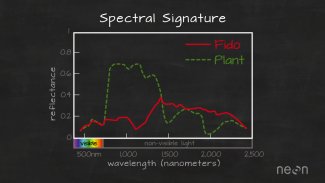
Plants reflect up to 60% more light in the near infrared part of the electromagnetic spectrum than in the green portion of the spectrum. Using imaging spectrometers to capture the invisible part of the spectrum, when converted into a spectral signature and combined with RBG imagery, provide spatial data that can shed light on changes to vegetation composition and cover.

How does NEON use spectral remote sensing?

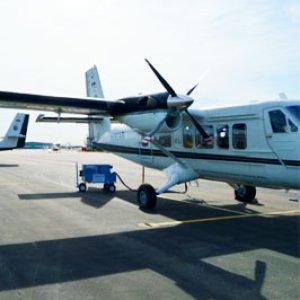
NEON conducts airborne observation flights annually over terrestrial and aquatic sites; the Airborne Observation Platform (AOP) includes an imaging spectrometer, a light detection and ranging (LiDAR) instrument and a high-resolution RGB camera. Spectral remote sensing data, when integrated with lidar and field observations is used to measure, understand and forecast ecological changes in:

  • Vegetation cover, composition and dominant vegetation type
  • Vegetation structure including height, density and Leaf Area Index (LAI)
  • Canopy chemistry
  • Vegetation health

Learn more about NEON’s Airborne Observation Platform collection methods.

More science videos and Data Skills resources

Check out other NEON science videos and subscribe to our YouTube channel to receive updates about new videos. For more on spectral remote sensing, check out the Data Skills portal for data skills tutorials on a variety of topics including spectral remote sensing.

Share

Related Posts:

Bug affecting neonUtilities in latest RStudio version on Windows

September 16, 2025

Discontinuation of Select NEON Data Products

January 29, 2026

Resolved: NEON AOP Lidar Data Quality Issues Due to Mis-Classified Atmospheric Noise

January 23, 2026

NSF NEON, Operated by Battelle

Follow Us:

Join Our Newsletter

Get updates on events, opportunities, and how NEON is being used today.

Subscribe Now

Footer

  • About Us
  • Contact Us
  • Terms & Conditions
  • Careers
  • Code of Conduct

Copyright © Battelle, 2026

The National Ecological Observatory Network is a major facility fully funded by the U.S. National Science Foundation.

Any opinions, findings and conclusions or recommendations expressed in this material do not necessarily reflect the views of the U.S. National Science Foundation.