Investigating the Diversity-Stability Relationship on a Grand Scale
November 10, 2022
There's no mistake – Earth's biodiversity is decreasing. Any loss in biodiversity can have significant impacts on how natural ecosystems respond to changing climate, invasive species, and ever-changing land-use. So, exactly how does biodiversity impact the stability of communities over time and across scales?
The Diversity-Stability Relationship (DSR) has been a topic of interest among ecologists since at least the 1950s, and is still a hot topic today. A recent paper in Nature: Ecology and Evolution - Consistent stabilizing effects of plant diversity across spatial scales and climatic gradients – uses NEON data to explore the relationship between plant biodiversity and temporal stability at both local and regional scales.
What Is the Diversity-Stability Relationship?
A prominent theory linked with the Diversity-Stability Relationship (DSR) is that more complex ecosystems (characterized by more diversity among species and taxa) will demonstrate more stability. "Stability" has many dimensions, but is often defined as the ability of an ecosystem to resist changes in core characteristics over time – characteristics including ecosystem functions and productivity.
Dr. Maowei Liang, a research scientist at the Cedar Creek Ecosystem Science Reserve at the University of Minnesota, is the lead author of the recent paper. He explains, "Many recent studies have made it very clear that we are seeing biodiversity loss on a global scale. If we don't take action to prevent biodiversity loss, we may lose many more species to extinction. We also know from studies that we need stability in our ecosystems in order to maintain all of the ecosystem services we want, like clean water or carbon capture. If ecosystems are not as stable in the future, it may mean that we will not get all of the services that we need."
While causal relationships between biodiversity and ecosystem stability have not been fully established, it is believed that greater species diversity may have a protective effect on stability—a phenomenon known as the portfolio effect. When many different species are available to fulfill critical ecosystem functions, these functions may be less vulnerable to environmental changes, such as changes in climate or the introduction of invasive species. This may be because different species have different responses to these changes.
Diversity is important not just at the species level but also at the landscape level—in other words, we want to see not just lots of local variation in plant species, but also lots of variation in types of ecosystems across large scales. Senior author Dr. Shaopeng Wang, an assistant professor at the Institute of Ecology at Peking University (and Liang's former advisor), explains, "This study has implications against the background of global biodiversity loss. Diversity is not only declining on a global scale, but we are also seeing different places become more and more similar to each other in terms of species composition. We expect that this biotic homogenization will impact stability."
Studying the Diversity-Stability Relationship Across Scales
While DSRs have been well documented in various biomes and taxa at the local level, there has been less agreement on how DSRs hold up on regional or continental scales with more heterogeneous environments. Some previous studies have suggested weak or even negative DSRs at larger scales. However, most of these studies relied on aggregated data from multiple local sites, which did not all follow the same data collection methods or use the same metrics. Wang says, "Since the 1990s, researchers have tried to create models to understand the relationship between diversity and ecosystem function stability. The classic debate seems to come from the fact that people are using different metrics [to measure stability]. In empirical studies, we have seen that diversity can decrease temporal variability in ecosystem function. In this study, we wanted to see if diversity would have the same stabilizing effects at large scales that have been documented at smaller scales."
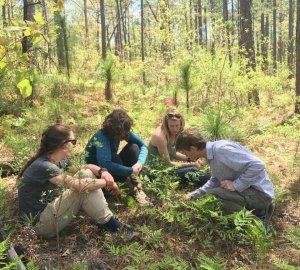
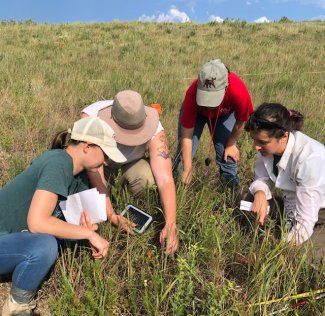
KONZ plant diversity protocol
The NEON datasets provided a unique opportunity to examine DSR at multiple scales. The researchers looked at NEON observational data for plant community composition (species identity and percent cover). In all, the datasets used for the study include more than 6,000 plant species at 7,560 quadrants and 945 plots at 36 terrestrial NEON sites, representing 16 of NEON's 20 ecoclimate zones (Domains). Each site has between four and eight years of data. The nested NEON spatial design allowed the researchers to analyze data at three scales:
1m x 1m quadrants
20m x 20m plots
Full NEON field sites (5 – 214 km2)
The analysis shows a strong and consistent positive relationship between plant diversity and temporal stability at all scales. Dr. Eric Sokol, a Quantitative Ecologist for the NEON program and a co-author on the paper, says, "These results are exciting because they suggest portfolio effects are important across all of the scales at which we are collecting data at NEON."
The nested spatial design and consistent data collection methods across NEON plots and sites allowed the authors to eliminate confounding variables that may result when aggregating data from multiple local studies. Liang says, "NEON uses a universal protocol, collecting data the same way at each plot and site. This gives us more confidence in our results. We are able to say that more diversity in plant species is correlated with more stability in ecosystem function at all scales."
Climate Factors and the DSR
The researchers were also able to look at climate data (temperature and precipitation) collected concurrently with the plant observations to examine critical questions such as:
How do climate factors affect diversity and stability at each scale?
How do the stabilizing effects of biodiversity change across spatial scales and environmental gradients?
The results show that seasonal variability in precipitation has the strongest impact on DSR. Areas with the most seasonal variability—such as the U.S. desert southwest, characterized by mostly arid conditions punctuated by an annual monsoon season—show weaker diversity-stability relationships. Liang explains, "We found that areas with stable precipitation all year round had strong diversity-stability relationships, but the relationship was weaker in areas with strong seasonality in precipitation. This tells us that climatic variability is important. There may also be some other confounding factors, biotic or abiotic, that affect DSR."
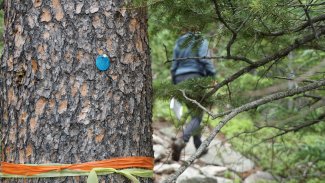
Phenology Tag on Pine tree at RMNP
Because this study is purely observational, it is not able to test causality. However, it does suggest intriguing linkages between climate factors and DSR. Sokol says, "Using NEON data, we can start to link the strength of the diversity-stability relationship to climate and see what aspects of climate may impact the mechanisms for stability."
Wang says, "If we think about global climate change, one of the impacts we see is that it makes fluctuations in climate stronger and stronger. If this weakens the diversity-stability relationship, that may mean that diversity will have a less protective effect in the future."
Bringing Together Networks for Large-Scale Ecology
The study is an exciting example of interdisciplinary collaboration across networks and institutions around the globe. The international team of authors included collaborators from China, France, the U.S., and the Netherlands. Liang says, "The NEON dataset makes this kind of interdisciplinary collaboration possible. People can use the data to extend the work—for example, several co-authors also participate in other DSR studies for birds and small mammals."
Wang adds, "NEON is a very rich source of data that is publicly available, so anyone can download it for different kinds of analysis. The larger spatial and temporal scales are exactly what we needed for our research. The people at NEON were very helpful, too."
Several co-authors—including Wang and Sokol, along with Lauren Hallett, an assistant professor at the University of Oregon—met through a Long-Term Ecological Research (LTER) synthesis working group. LTER is a network of long-term research sites, each with its own research priorities. Sokol was a lead PI for one of the synthesis working groups before joining the NEON program in 2017. He says, "A lot of what we have been doing for this study stemmed from those working relationships. NEON and LTER data users are exploring similar questions. People from both networks are collaborating on data interoperability." While this study only used NEON data, Sokol hopes to see additional research incorporating data from both groups. He says, "Progress in ecology will require synergy between NEON, LTER and similar networks internationally."
Wang and Liang would like to see further studies test the DSR framework internationally and across longer time periods. They also want to further explore causal relationships between diversity and stability. They are already working on additional analyses using NEON data. Wang now has students looking at DSR across 25 LTER sites.
Liang says, "There are so many opportunities to look at different relationships. A lot of people want to test causal relationships. This study just looked at temperature and precipitation, but in the future, we could look at flux tower data and other variables, like soil data. We want to know why some places have a strong DSR and others have weaker relationships. That would be a good direction to go next. Our paper shows what we can do with the NEON dataset."