In this lesson, we provide an overview of the National Ecological Observatory Network (NEON).
Read through these materials and links that discuss NEON’s mission and design in order to gain a better understanding of NEON, NEON's mission and the openly available datasets.
This lesson was originally designed for NEON's Remote Sensing Data Institute, but can be used more broadly for those interested in gaining general knowledge about the NEON program and NEON data.
Learning Objectives
At the end of this activity, you will be able to:
Explain the mission of the National Ecological Observatory Network (NEON).
Explain how sites are located within the NEON project design.
Explain the different types of data that are collected and provided by NEON.
NEON's Mission & Design
To capture ecological heterogeneity across the United States, NEON’s design
divides the continent into 20 statistically different eco-climatic domains. Each
NEON field site is located within an eco-climatic domain.
The Science and Design of NEON
To gain a better understanding of the broad scope of NEON, watch this 4 minute long video.
Explore the NEON field site map. Do the following:
Zoom in on a study area of interest to see if there are any NEON field sites that are nearby.
Use the menu below the map to filter sites by name, type, domain, or state.
Select one field site of interest.
Click on the marker in the map.
Then click on Site Details to jump to the field site landing page.
Data Institute Participant -- Thought Questions:
Use the map above to answer these questions. Consider the research question that
you may explore as your Capstone Project at the Institute or about a current
project that you are working on and answer the following questions:
Are there NEON field sites that are in study regions of interest to you?
What domains are the sites located in?
What NEON field sites do your current research or Capstone Project ideas coincide with?
Is/are the site(s) of interest core or gradient?
Are the sites terrestrial or aquatic?
Are there data available for the NEON field site(s) that you are most interested in? What kind of data are available at those sites?
Watch this 3:06 minute video exploring the data that NEON collects.
Read the
Data Collection Methods
page to learn more about the different types of data that NEON collects and
provides. Then, follow the links below to learn more about each collection method:
NEON also collects samples and specimens from which the other data products are based. These samples are also available for research and education purposes. Learn more:
NEON Biorepository.
Airborne Remote Sensing
Watch this 5 minute video to better understand the NEON Airborne Observation Platform (AOP).
Data Institute Participant – Thought Questions:
Consider either your current or future research or the question you’d like to address at the Institute, or for your research.
Which types of NEON data would be more useful to address these questions?
What non-NEON data resources could be combined with NEON data to help address your question?
What challenges, if any, could you foresee when beginning to work with these data?
Data Tip: NEON also provides research support services to supplement your own research, including proposals to fly the AOP over other study sites, a mobile
tower/instrumentation setup and others. Learn more here about the NEON Research Support Services (RSS).
Access NEON Data
NEON data are processed and go through quality assurance quality control checks at NEON headquarters in Boulder, CO.
NEON carefully documents every aspect of sampling design, data collection, processing and delivery. This documentation is freely available through the NEON data portal.
Explore NEON Data Products.
On the page for each data product in the catalog you can find basic information about the product, a quick start guide and the data collection and processing protocols, and you can download data products for given sites and date ranges.
Additionally, some types of NEON data are also available through the data portals of other organizations. For example,
NEON Terrestrial Insect DNA Barcoding Data
is available through the
Barcode of Life Datasystem (BOLD).
Or NEON phenocam images are available from the
Phenocam network site.
More details on other places the data are available from can be found in the Availability and Download section on the Product Details page for each data product (visit
Explore Data Products to access individual Product Details pages).
Pathways to access NEON Data
There are several ways to access data from NEON:
Via the NEON data portal. Explore and download data. Note that much of the tabular data is available in zipped
.csv files for each month and site of interest. To combine these files, use the R
neonUtilities package or Python neonutilities package. See the Download Explore NEON Data tutorial for an overview of how to use the neonUtilities packages to download and work with NEON data.
Use R or Python to programmatically access the data. NEON and community members have created code packages to directly access the data through an API. Learn more
about the available resources by reading the Code Hub or visiting the NEONScience GitHub repository.
Using the NEON API. Access NEON data directly using a custom API call.
Access NEON data through partner's portals. Where NEON data directly overlap with other community resources, NEON data can be accessed through the portals.
Examples include Phenocam, BOLD, Ameriflux, Google Earth Engine and others. You can learn more in the documentation for individual data products.
Data Institute Participant – Thought Questions:
Use the Data Portal tools to investigate the data availability for the field sites you’ve already identified in the previous Thought Questions.
What types of aquatic/terrestrial data are currently available? Remote sensing data?
Of these, what type of data are you most interested in working with for your project while at the Institute.
What time period does the data cover?
What format is the downloadable file available in?
Where is the metadata to support this data?
Data Institute Participants: Intro to NEON Culmination Activity
Write up a brief summary of a project that you might want to explore while at the
Data Institute in Boulder, CO. Include the types of NEON (and other data) that you
will need to implement this project. Save this summary as you will be refining
and adding to your ideas over the next few weeks.
The goal of this activity is for you to begin to think about a Capstone Project
that you wish to work on at the end of the Data Institute. This project will ideally be
performed in groups, so over the next few weeks you'll have a chance to view the other
project proposals and merge projects to collaborate with your colleagues.
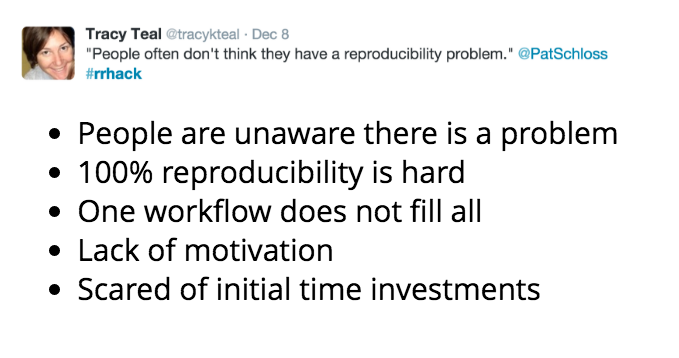
Verifiability and reproducibility are among the cornerstones of the scientific
process. They are what allows scientists to "stand on the shoulder of giants".
Maintaining reproducibility requires that all data management, analysis, and
visualization steps behind the results presented in a paper are documented and
available in full detail. Reproducibility here means that someone else should
either be able to obtain the same results given all the documented inputs and
the published instructions for processing them, or if not, the reasons why
should be apparent.
From Reproducible Science Curriculum
## Learning Objectives
At the end of this activity, you will be able to:
Summarize the four facets of reproducibility.
Describe several ways that reproducible workflows can improve your workflow and research.
Explain several ways you can incorporate reproducible science techniques into
your own research.
Getting Started with Reproducible Science
Please view the online slide-show below which summarizes concepts taught in the
Reproducible Science Curriculum.
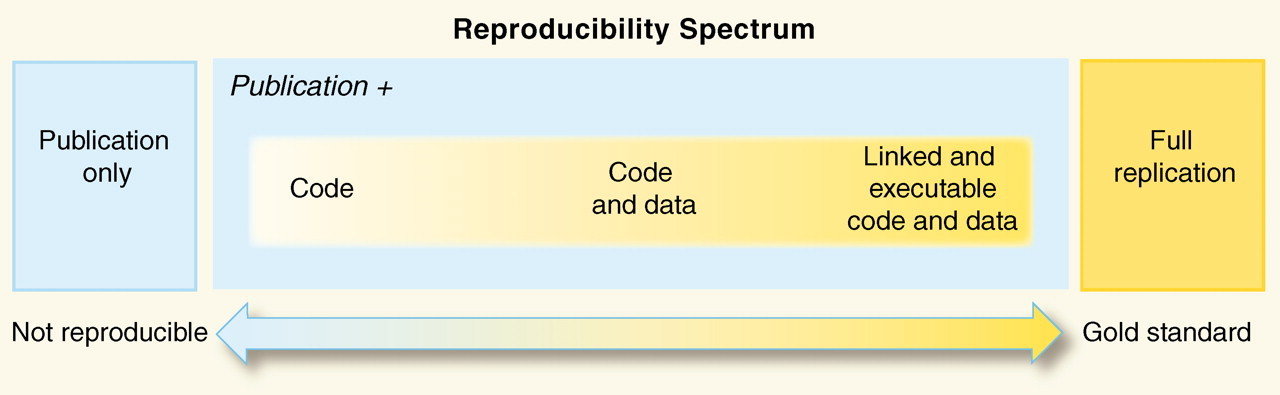
Reproducibility spectrum for published research.
Source: Peng, RD Reproducible Research in Computational Science Science (2011): 1226–1227 via Reproducible Science Curriculum
The Nature Publishing group has also created a
Reporting Checklist
for its authors that focuses primaily on reporting issues but also includes
sections for sharing code.
Recent open-access issue of
Ecography
focusing on reproducible ecology and software packages available for use.
A nice short blog post with an annotated bibliography of "Top 10 papers discussing reproducible research in computational science" from Lorena Barba:
Barba group reproducibility syllabus.
After completing this tutorial, you will be able to:
Define hyperspectral remote sensing.
Explain the fundamental principles of hyperspectral remote sensing data.
Describe the key attributes that are required to effectively work with
hyperspectral remote sensing data in tools like R or Python.
Describe what a "band" is.
Mapping the Invisible
About Hyperspectral Remote Sensing Data
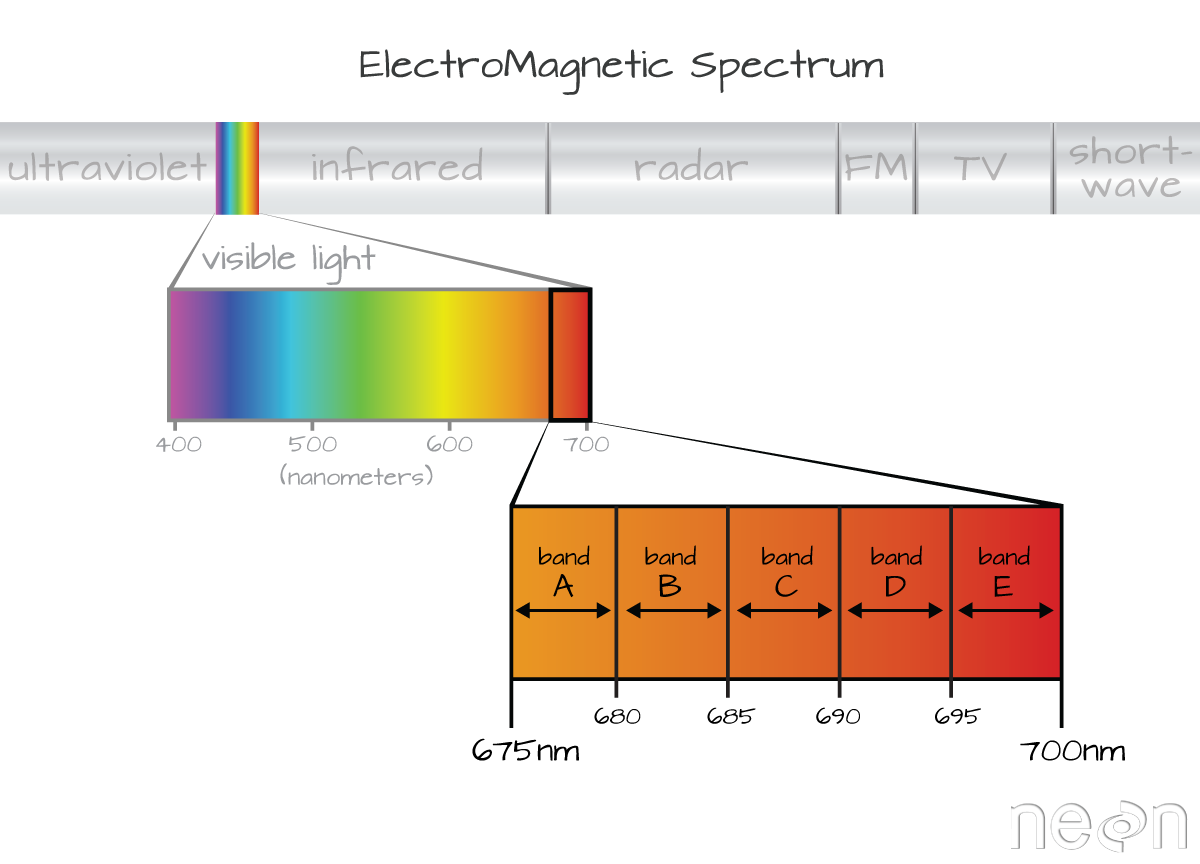
The electromagnetic spectrum is composed of thousands of bands representing
different types of light energy. Imaging spectrometers (instruments that collect
hyperspectral data) break the electromagnetic spectrum into groups of bands
that support classification of objects by their spectral properties on the
earth's surface. Hyperspectral data consists of many bands -- up to hundreds of
bands -- that cover the electromagnetic spectrum.
The NEON imaging spectrometer collects data within the 380nm to 2510nm portions
of the electromagnetic spectrum within bands that are approximately 5nm in
width. This results in a hyperspectral data cube that contains approximately
426 bands - which means big, big data.
Key Metadata for Hyperspectral Data
Bands and Wavelengths
A band represents a group of wavelengths. For example, the wavelength values
between 695nm and 700nm might be one band as captured by an imaging spectrometer.
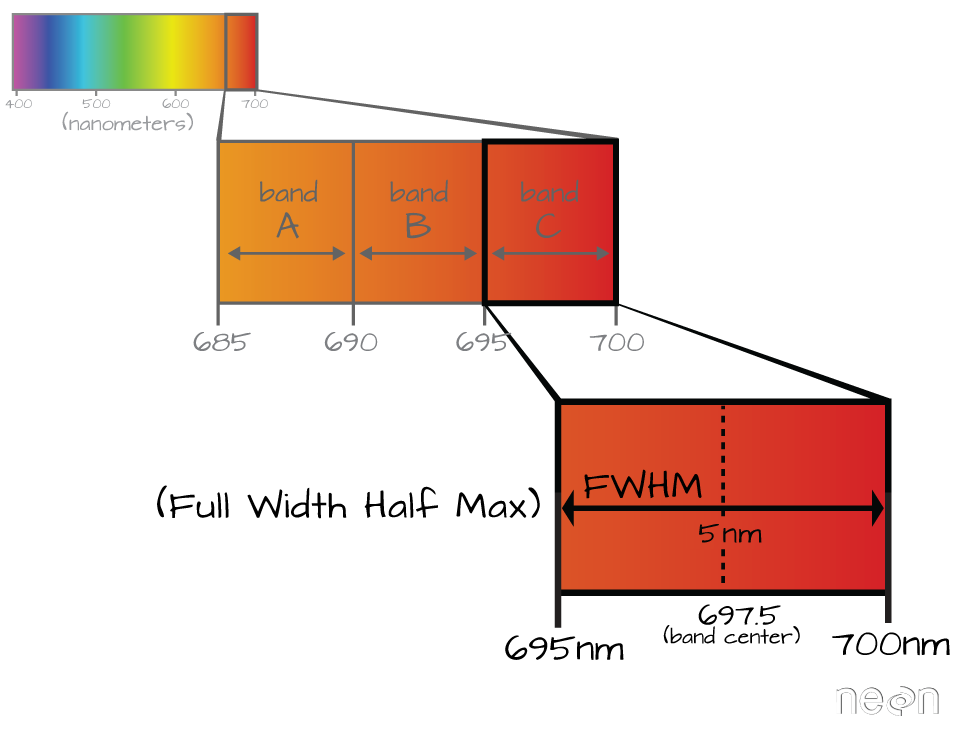
The imaging spectrometer collects reflected light energy in a pixel for light
in that band. Often when you work with a multi or hyperspectral dataset, the
band information is reported as the center wavelength value. This value
represents the center point value of the wavelengths represented in that band.
Thus in a band spanning 695-700 nm, the center would be 697.5).
Imaging spectrometers collect reflected light information within
defined bands or regions of the electromagnetic spectrum. Source: National
Ecological Observatory Network (NEON)
Spectral Resolution
The spectral resolution of a dataset that has more than one band, refers to the
width of each band in the dataset. In the example above, a band was defined as
spanning 695-700nm. The width or spatial resolution of the band is thus 5
nanometers. To see an example of this, check out the band widths for the
Landsat sensors.
Full Width Half Max (FWHM)
The full width half max (FWHM) will also often be reported in a multi or
hyperspectral dataset. This value represents the spread of the band around that
center point.
The Full Width Half Max (FWHM) of a band relates to the distance
in nanometers between the band center and the edge of the band. In this
case, the FWHM for Band C is 5 nm.
In the illustration above, the band that covers 695-700nm has a FWHM of 5 nm.
While a general spectral resolution of the sensor is often provided, not all
sensors create bands of uniform widths. For instance bands 1-9 of Landsat 8 are
listed below (Courtesy of USGS)