Tutorial
HDFView: Exploring HDF5 Files in the Free HDFview Tool
Last Updated: Apr 30, 2026
In this tutorial you will use the free HDFView tool to explore HDF5 files and the groups and datasets contained within. You will also see how HDF5 files can be structured and explore metadata using both spatial and temporal data stored in HDF5!
Learning Objectives
After completing this activity, you will be able to:
- Explain how data can be structured and stored in HDF5 format.
- Navigate to metadata in an HDF5 file, making it "self describing".
- Explore HDF5 files using the free HDFView application.
Tools You Will Need
Install the free HDFView application. This application allows you to explore the contents of an HDF5 file easily. Click here to go to the download page.
Data to Download
Download NEON Imaging Spectrometer Data at SJER (2024) - NEON_D17_SJER_DP3_254000_4108000_bidirectional_reflectance.h5
These hyperspectral remote sensing data provide information on the National Ecological Observatory Network's San Joaquin Exerimental Range field site. The data were collected over the San Joaquin field site located in California (Domain 17) and processed at NEON headquarters. The entire dataset can be accessed from the Spectrometer orthorectified surface bidirectional reflectance - mosaic page on the NEON data portal.
Download NEON Eddy Covariance Data at SJER (2024-04-01)
The SAE data were collected by the National Ecological Observatory Network's flux towers at field sites across the US. The entire dataset can be accessed from the Bundled data products - eddy covariance page on the NEON data portal.
Download Eddy Covariance DatasetInstalling HDFView
Select the HDFView download option that matches the operating system (Mac OS X, Windows, or Linux) and computer setup (32 bit vs 64 bit) that you have.
Hierarchical Data Format 5 - HDF5
Hierarchical Data Format version 5 (HDF5), is an open file format that supports large, complex, heterogeneous data. Some key points about HDF5:
- HDF5 uses a "file directory" like structure.
- The HDF5 data models organizes information using
Groups. Each group may contain one or moredatasets. - HDF5 is a self describing file format. This means that the metadata for the data contained within the HDF5 file, are built into the file itself.
- One HDF5 file may contain several heterogeneous data types (e.g. images, numeric data, data stored as strings).
For more introduction to the HDF5 format, see our About Hierarchical Data Formats - What is HDF5? tutorial.
In this tutorial, we will explore two different types of data saved in HDF5. This will allow us to better understand how one file can store multiple different types of data, in different ways.
Part 1: Exploring Hyperspectral Imagery stored in HDF5

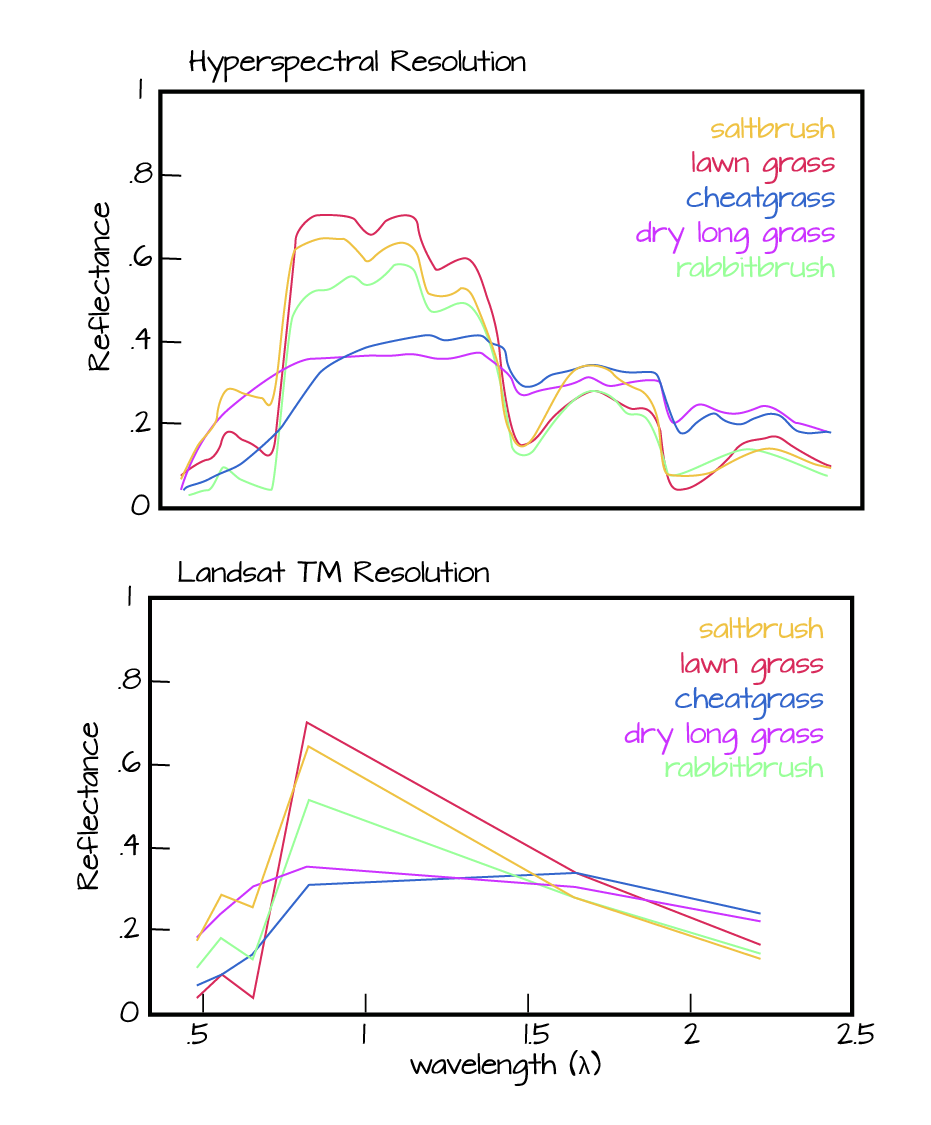
First, we will explore a hyperspectral dataset, collected by the NEON Airborne Observation Platform (AOP) and saved in HDF5 format. In the hyperpsectral data cubes, each pixel in the dataset contains reflectance values for hundreds of bands (426) collected by the sensor.
A few notes about hyperspectral imagery:
- An imaging spectrometer, which collects hyperspectral imagery, records light energy reflected off objects on the earth's surface.
- The data are inherently spatial. Each pixel in the image is located spatially and represents an area of ground on the earth.
- Similar to an RGB (Red, Green, Blue) camera, an imaging spectrometer records reflected light energy. Each pixel contain several hundred bands of reflectance data.
Read more about hyperspectral remote sensing data:
- About Hyperspectral Remote Sensing Data tutorial on this site.
Let's open some hyperspectral imagery stored in HDF5 format to see what the file structure can like for a different type of data.
Open the Reflectance H5 file in HDFView
To begin, open the HDFView application.
Within the HDFView application, select File --> Open and navigate to the folder
where you saved the NEON_D17_SJER_DP3_254000_4108000_bidirectional_reflectance.h5 file on your computer. Open this file in HDFView.
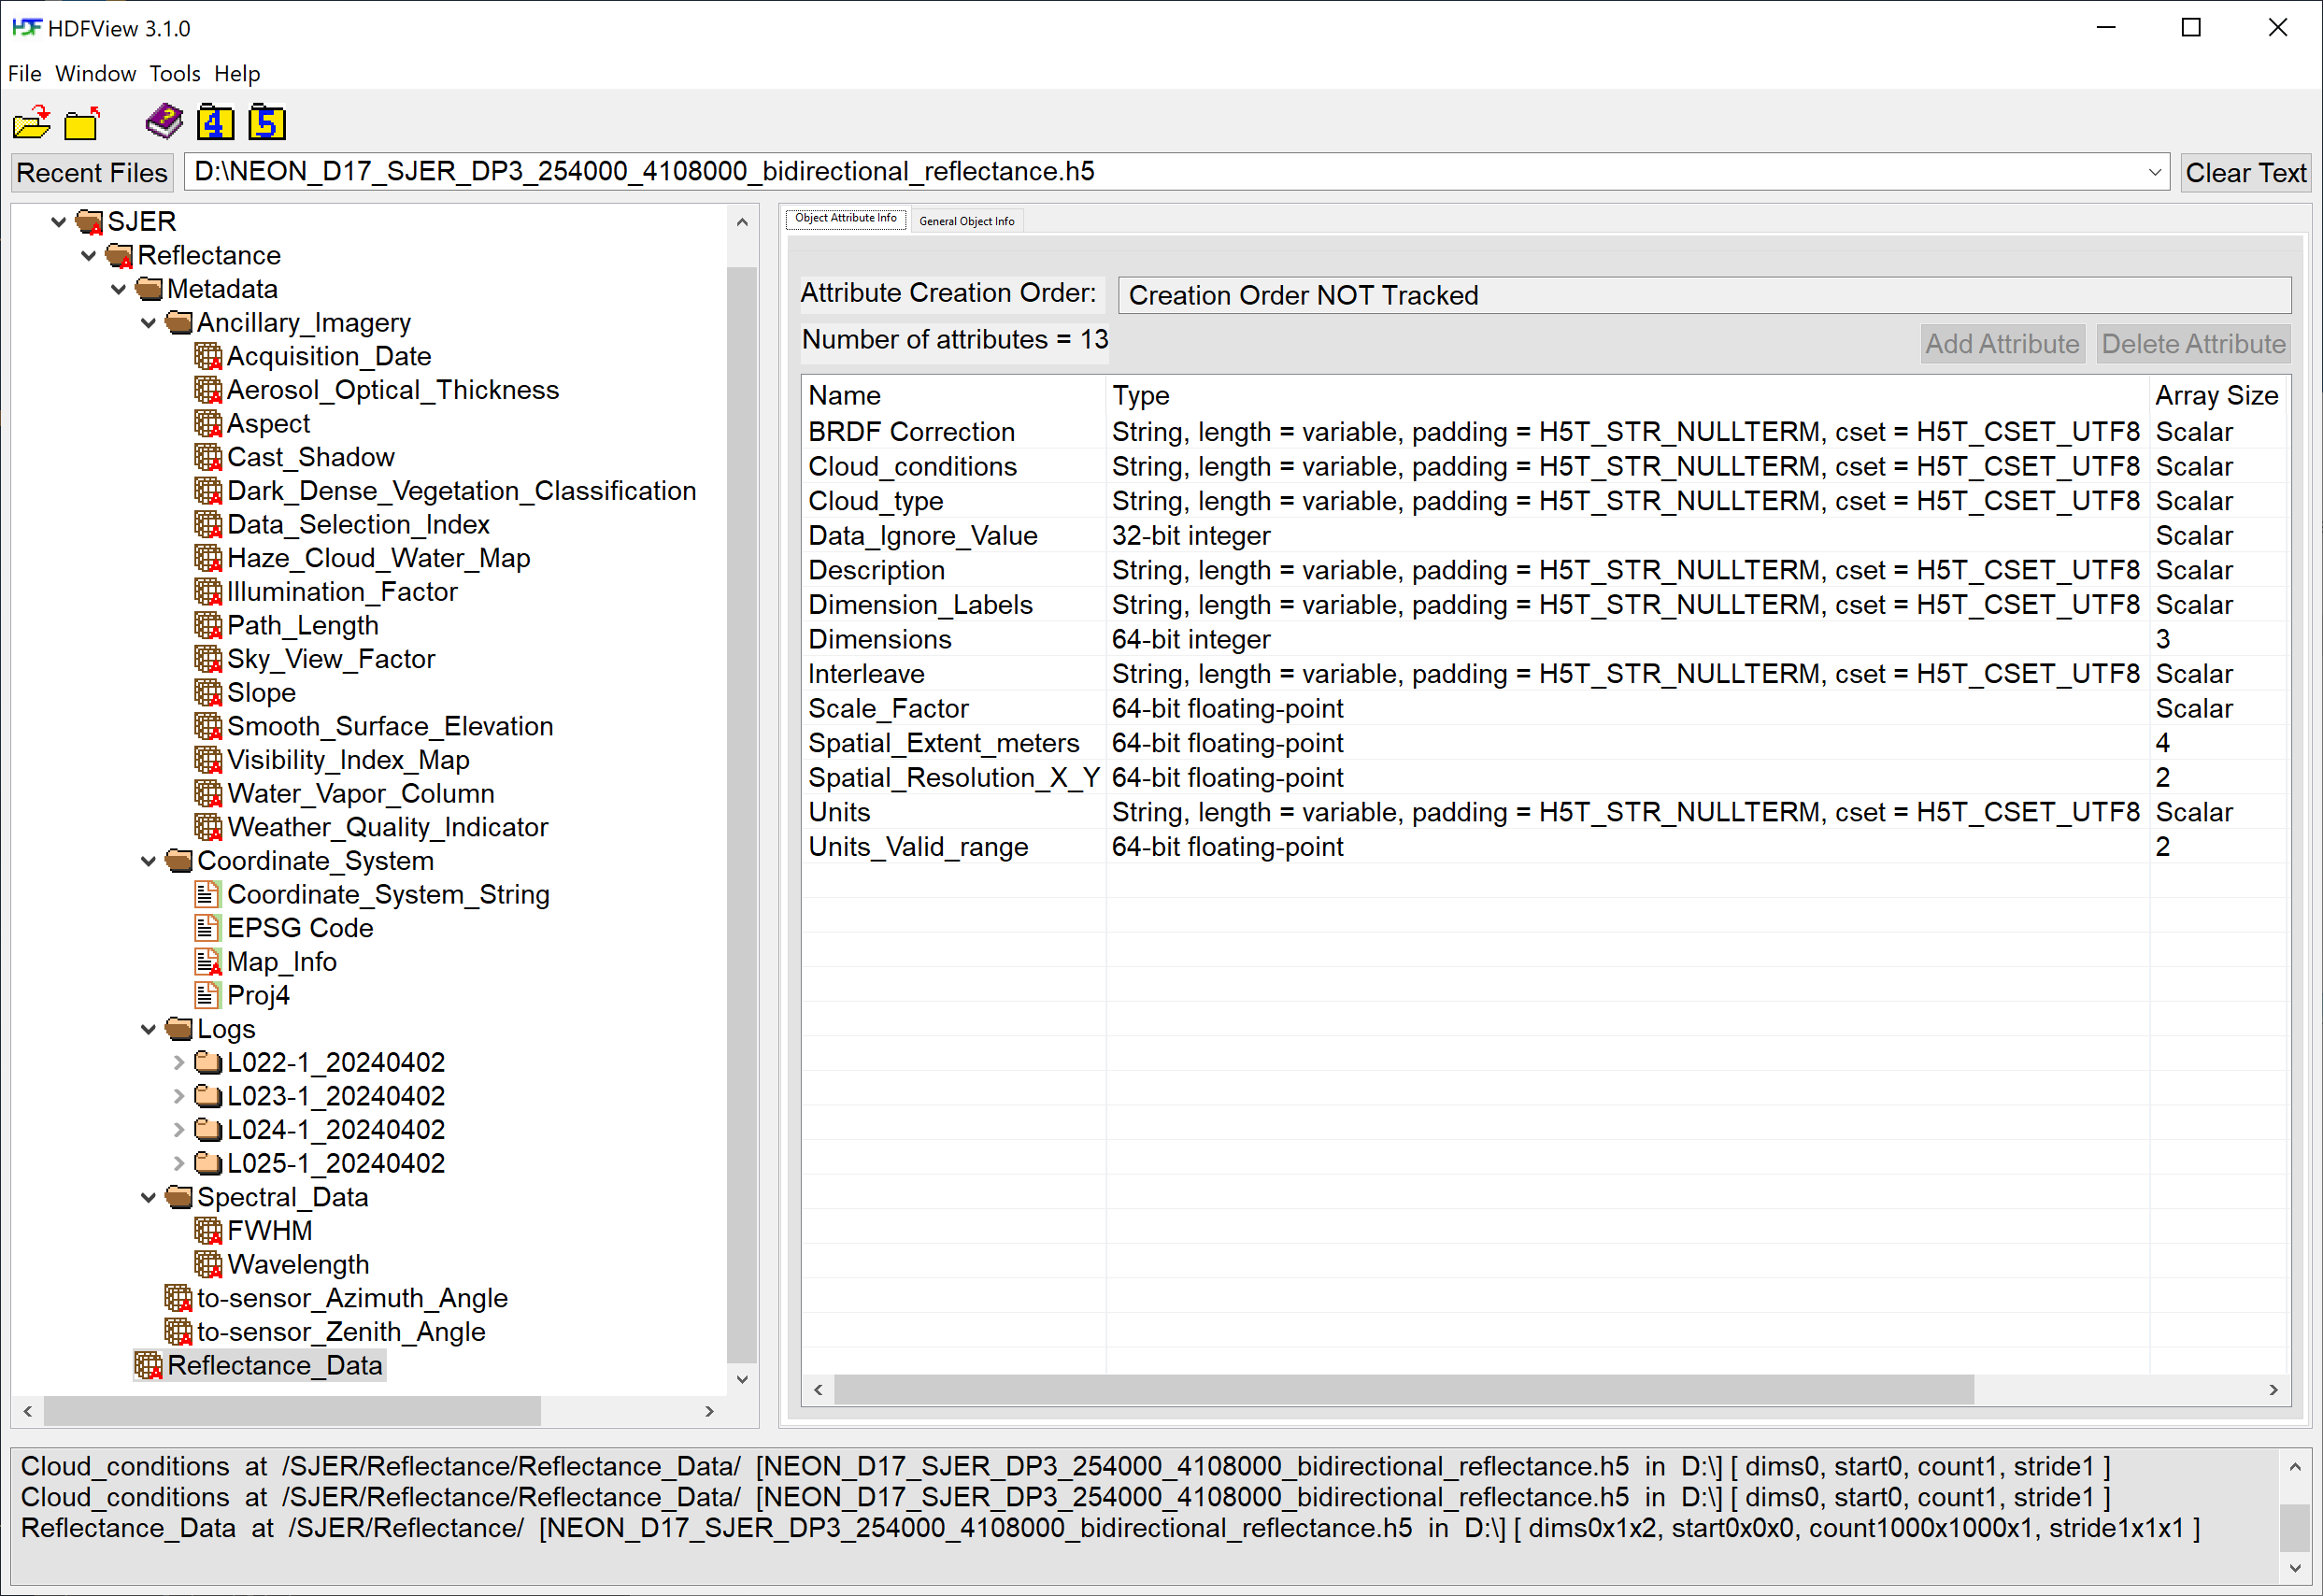
Open the file and expand the sub-folders. This file is composed of a Reflectance dataset (called Reflectance_Data) along with additional Metadata containing the following sub-folders:
-
Ancillary_Imagery: Datasets including ATCOR inputs and other Quality indicators such as theWeather_Quality_Indicator, containing information about the cloud conditions during the flight (for each pixel). -
Coordinate_System: geographic information for the dataset. -
Logs: Log files for each flight line containing ATCOR processing information and inputs, BRDF correction parameters, and the solar azimuth and zenith angles. -
Spectral_Data: Full Width Half Max (FWHM) and Wavelength for each of the 426 spectral bands.
Let's first look at the metadata stored in the Coordinate_System folder. This group contains all of the spatial information that a GIS program would need to project the data spatially.
Next, double click on the Wavelength dataset. Note that this dataset contains the central wavelength value for each band in the dataset.
Finally, click on the Reflectance_Data dataset. Note that in the metadata for the dataset that the structure of the dataset is 426 x 1000 x 1000 (wavelength, x, y), as indicated in the metadata. Right click on the reflectance dataset and select Open As. Click Image in the "display as" settings on the left hand side of the popup.
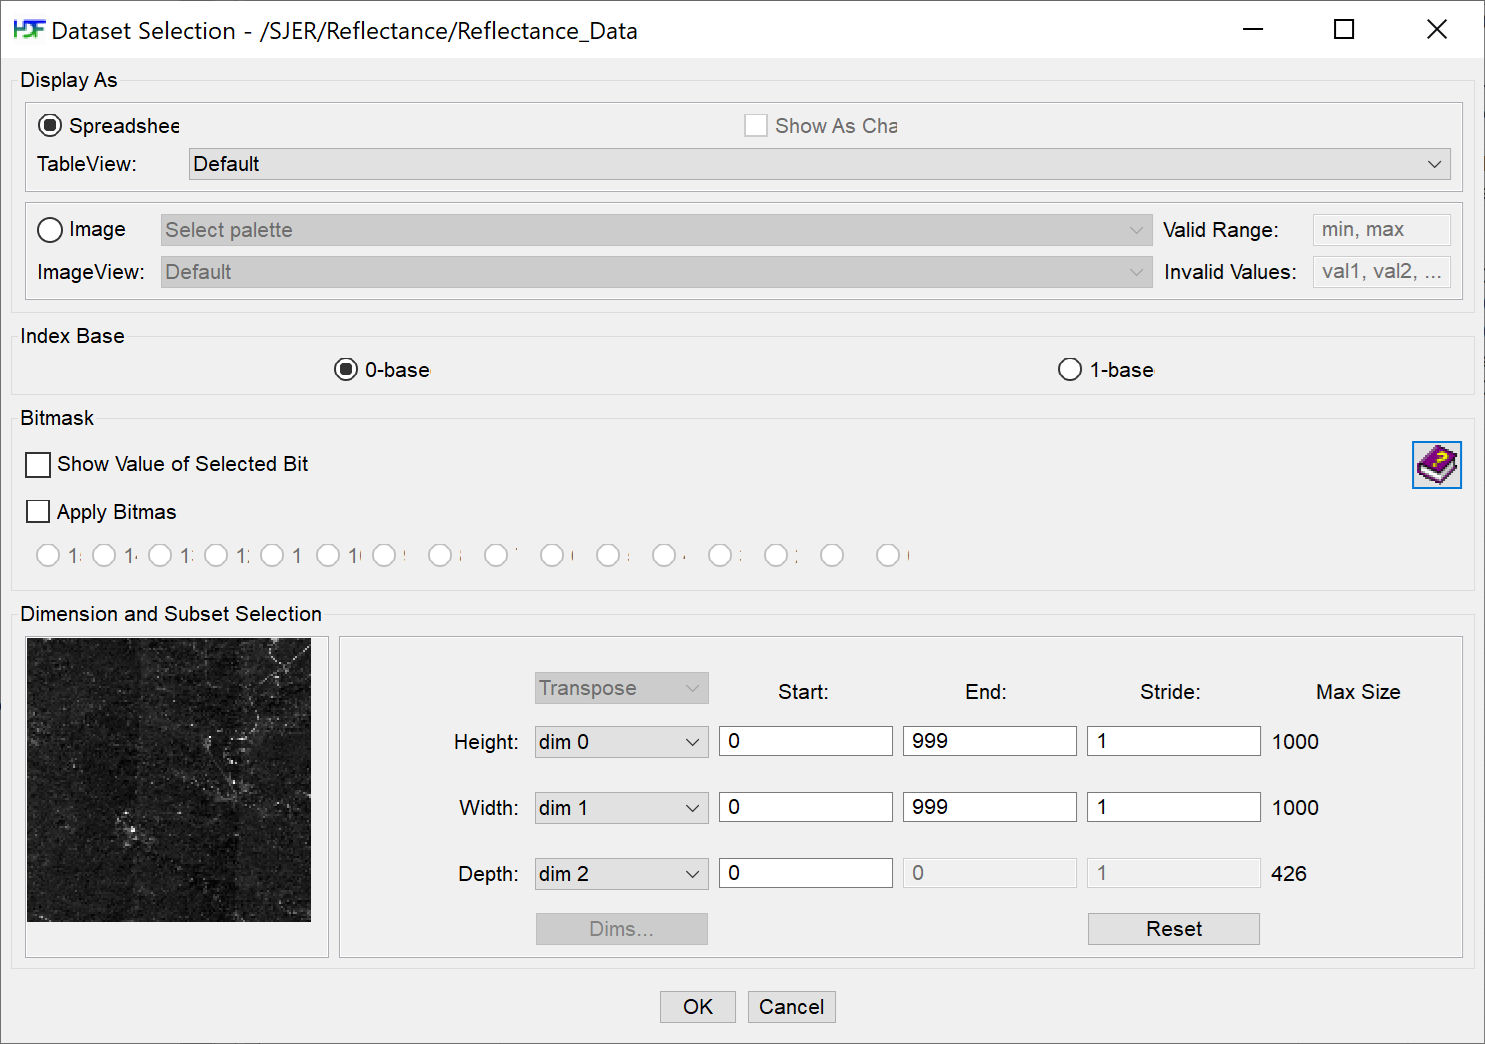
Notice an image preview appears on the left of the pop-up window. Click OK to open the image. You may have to play with the brightness and contrast settings in the viewer to see the data properly.
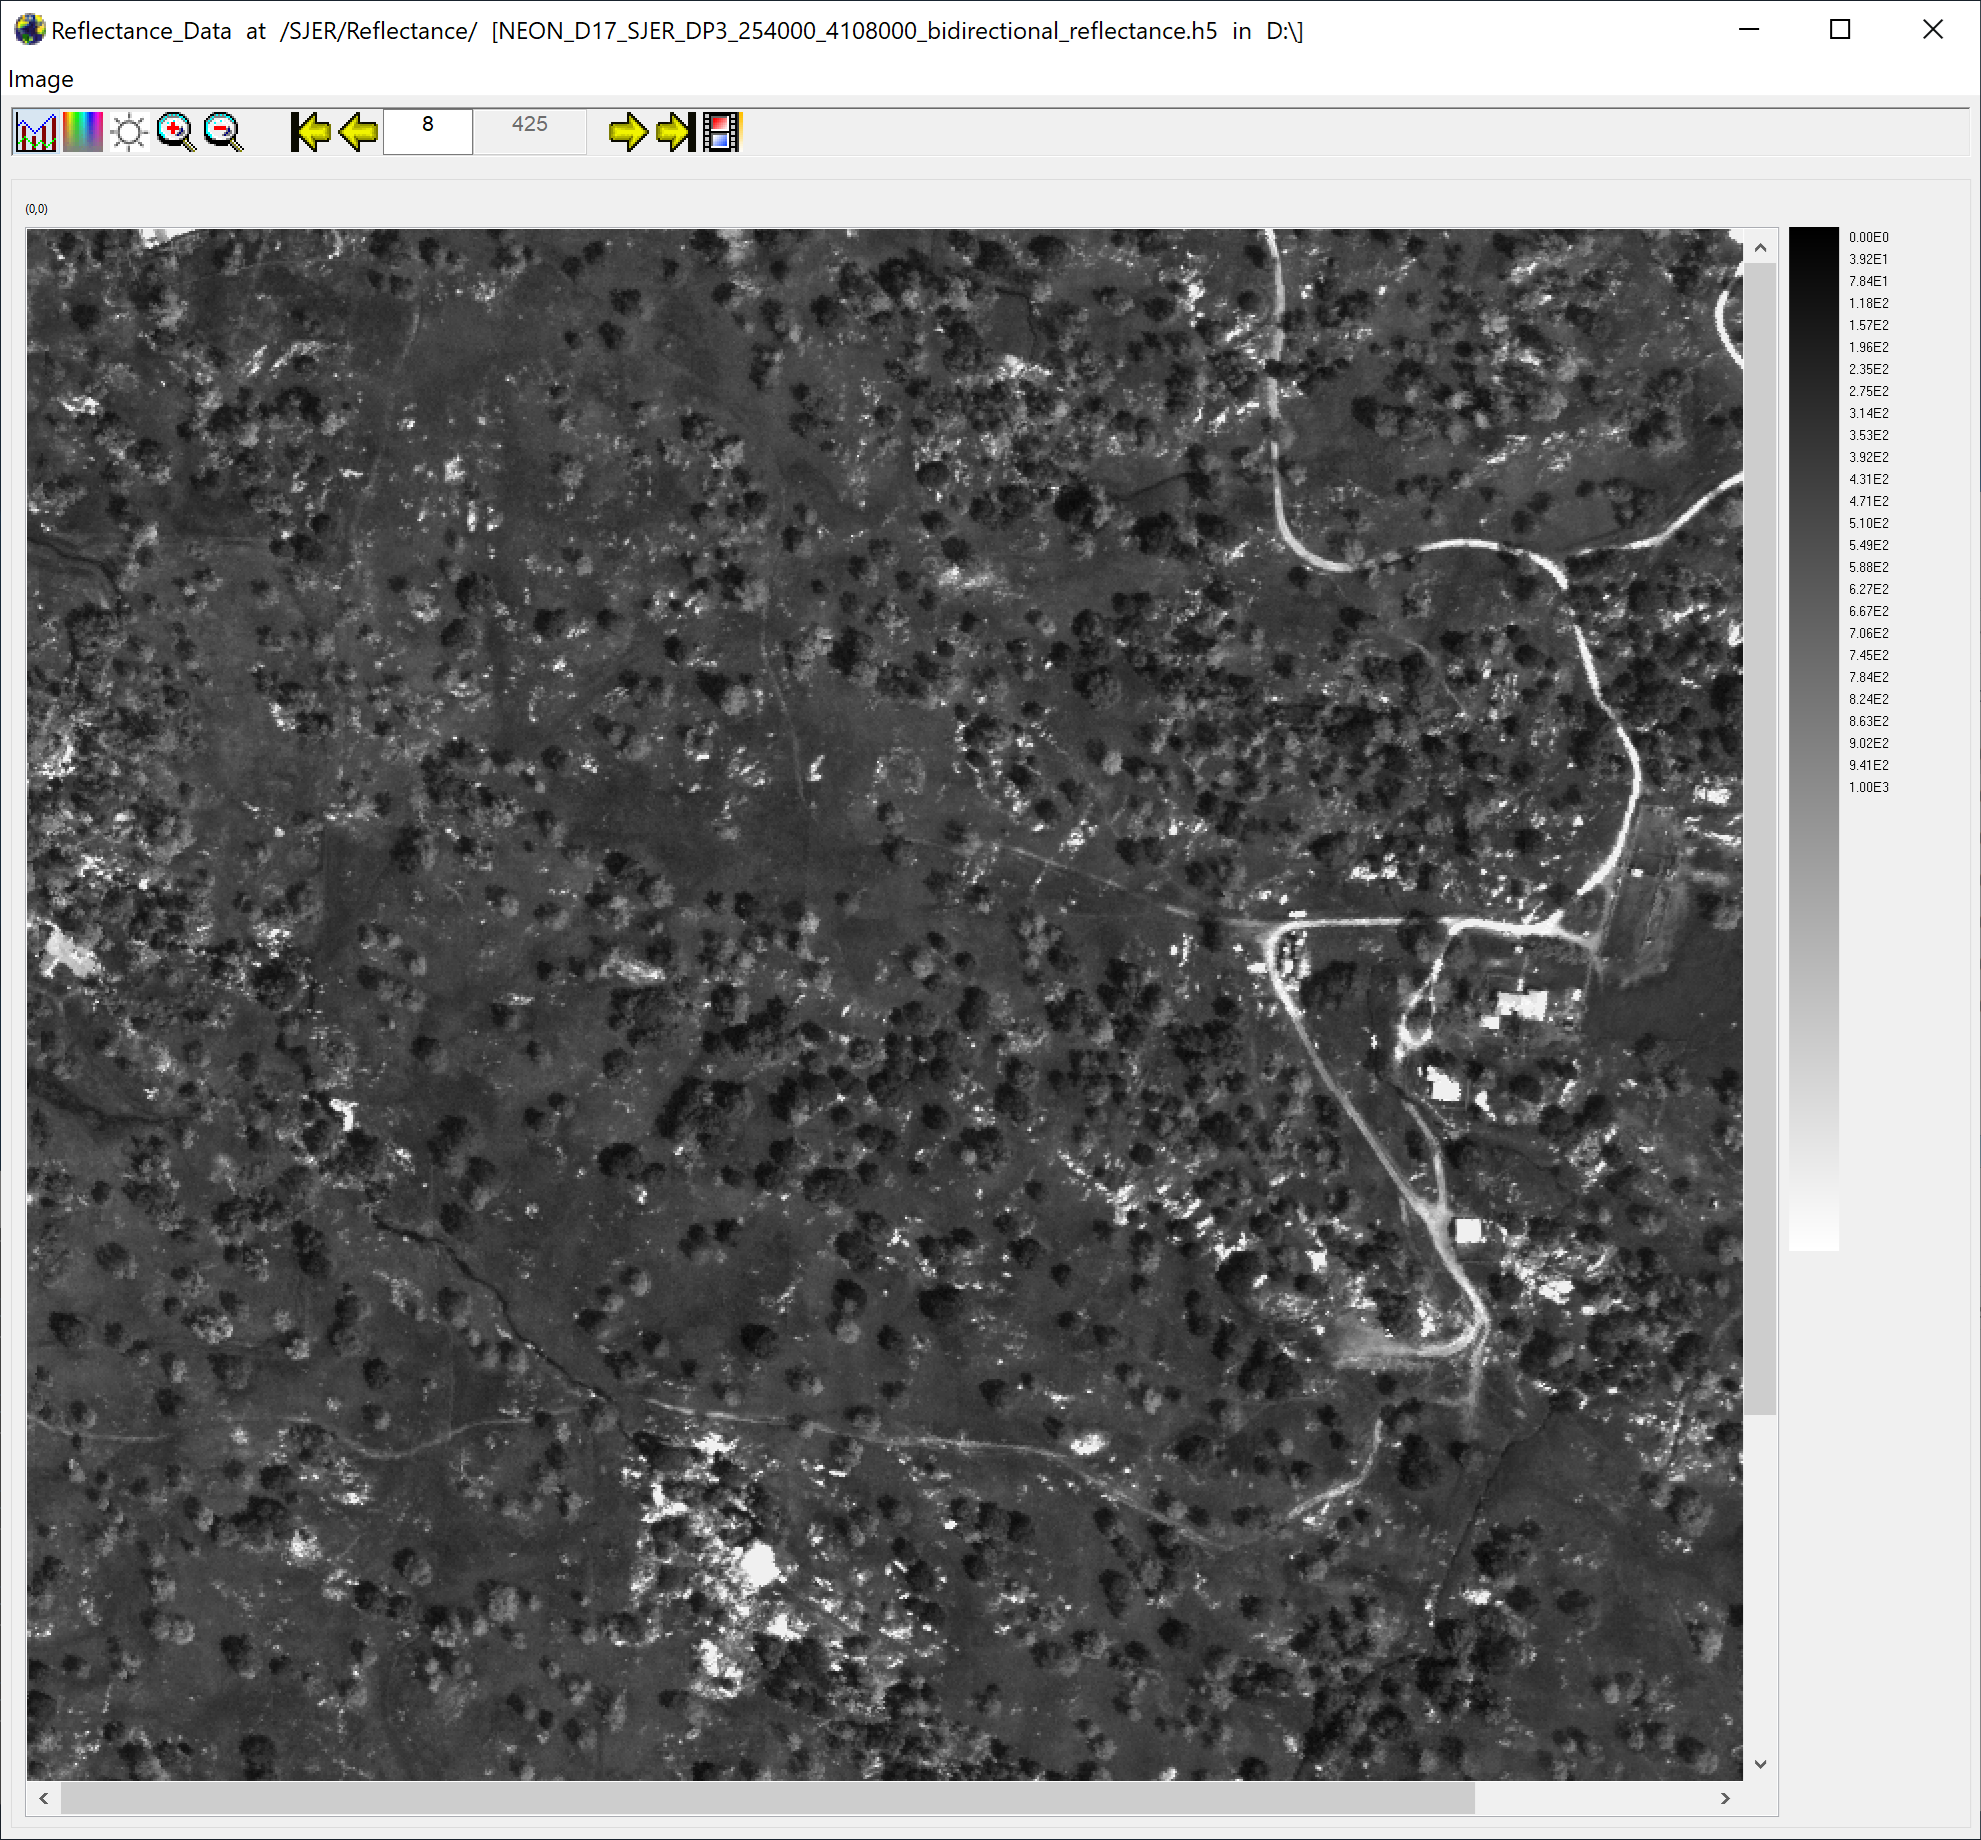
Explore the spectral dataset in the HDFViewer taking note of the metadata and data stored within the file.
Part 2: Exploring Surface Atmosphere Exchange (SAE) Data in HDFView
Next, we will look at the SAE bundled eddy covariance h5 data. As in the first part, we will start by opening the h5 file (download from the link at the top of this tutorial) in the viewer to get a better idea of how this data is structured.
Open the Bundled Eddy Covariance H5 file in HDFView
Open the HDFView application. Within the application, select File --> Open and navigate to the folder where you saved the SAE hdf5 file on your computer. Open this file in HDFView.
If you click on the name of the HDF5 file in the left hand window of HDFView, you can view metadata for the file. This will be located in the bottom window of the application.
Explore File Structure in HDFView
Next, explore the structure of this bundled eddy covariane file.
Notice at the bottom there is a readMe attribute. If you double click on this, you'll see the text "Net Surface Atmosphere Exchange (NSAE) HDF5 File Structure Description. The NSAE file you downloaded from NEON data portal is in the HDF5 format. This document describes the HDF5 file structure. This file will provide the HDF5 hierarchical layout of the file and a description of each HDF5 group level. The full descriptions of objects can be found in the objDesc data table provided within the HDF5 file. The 'Exploring NEON Eddy-Covariance Data Products in HDF5 file format' document provides a greater level of detail ..."
Documentation for each NEON data product is contained on the respective data product page. It is strongly recommended to peruse the relevant documentation, starting with the Quick Start Guides. The document referenced above in the readMe is linked here: Exploring NEON Eddy-Covariance Data Products in HDF5 file format .
Now that you've read the readMe, and referencing the document above, take a look at the structure of the data in HDFView.
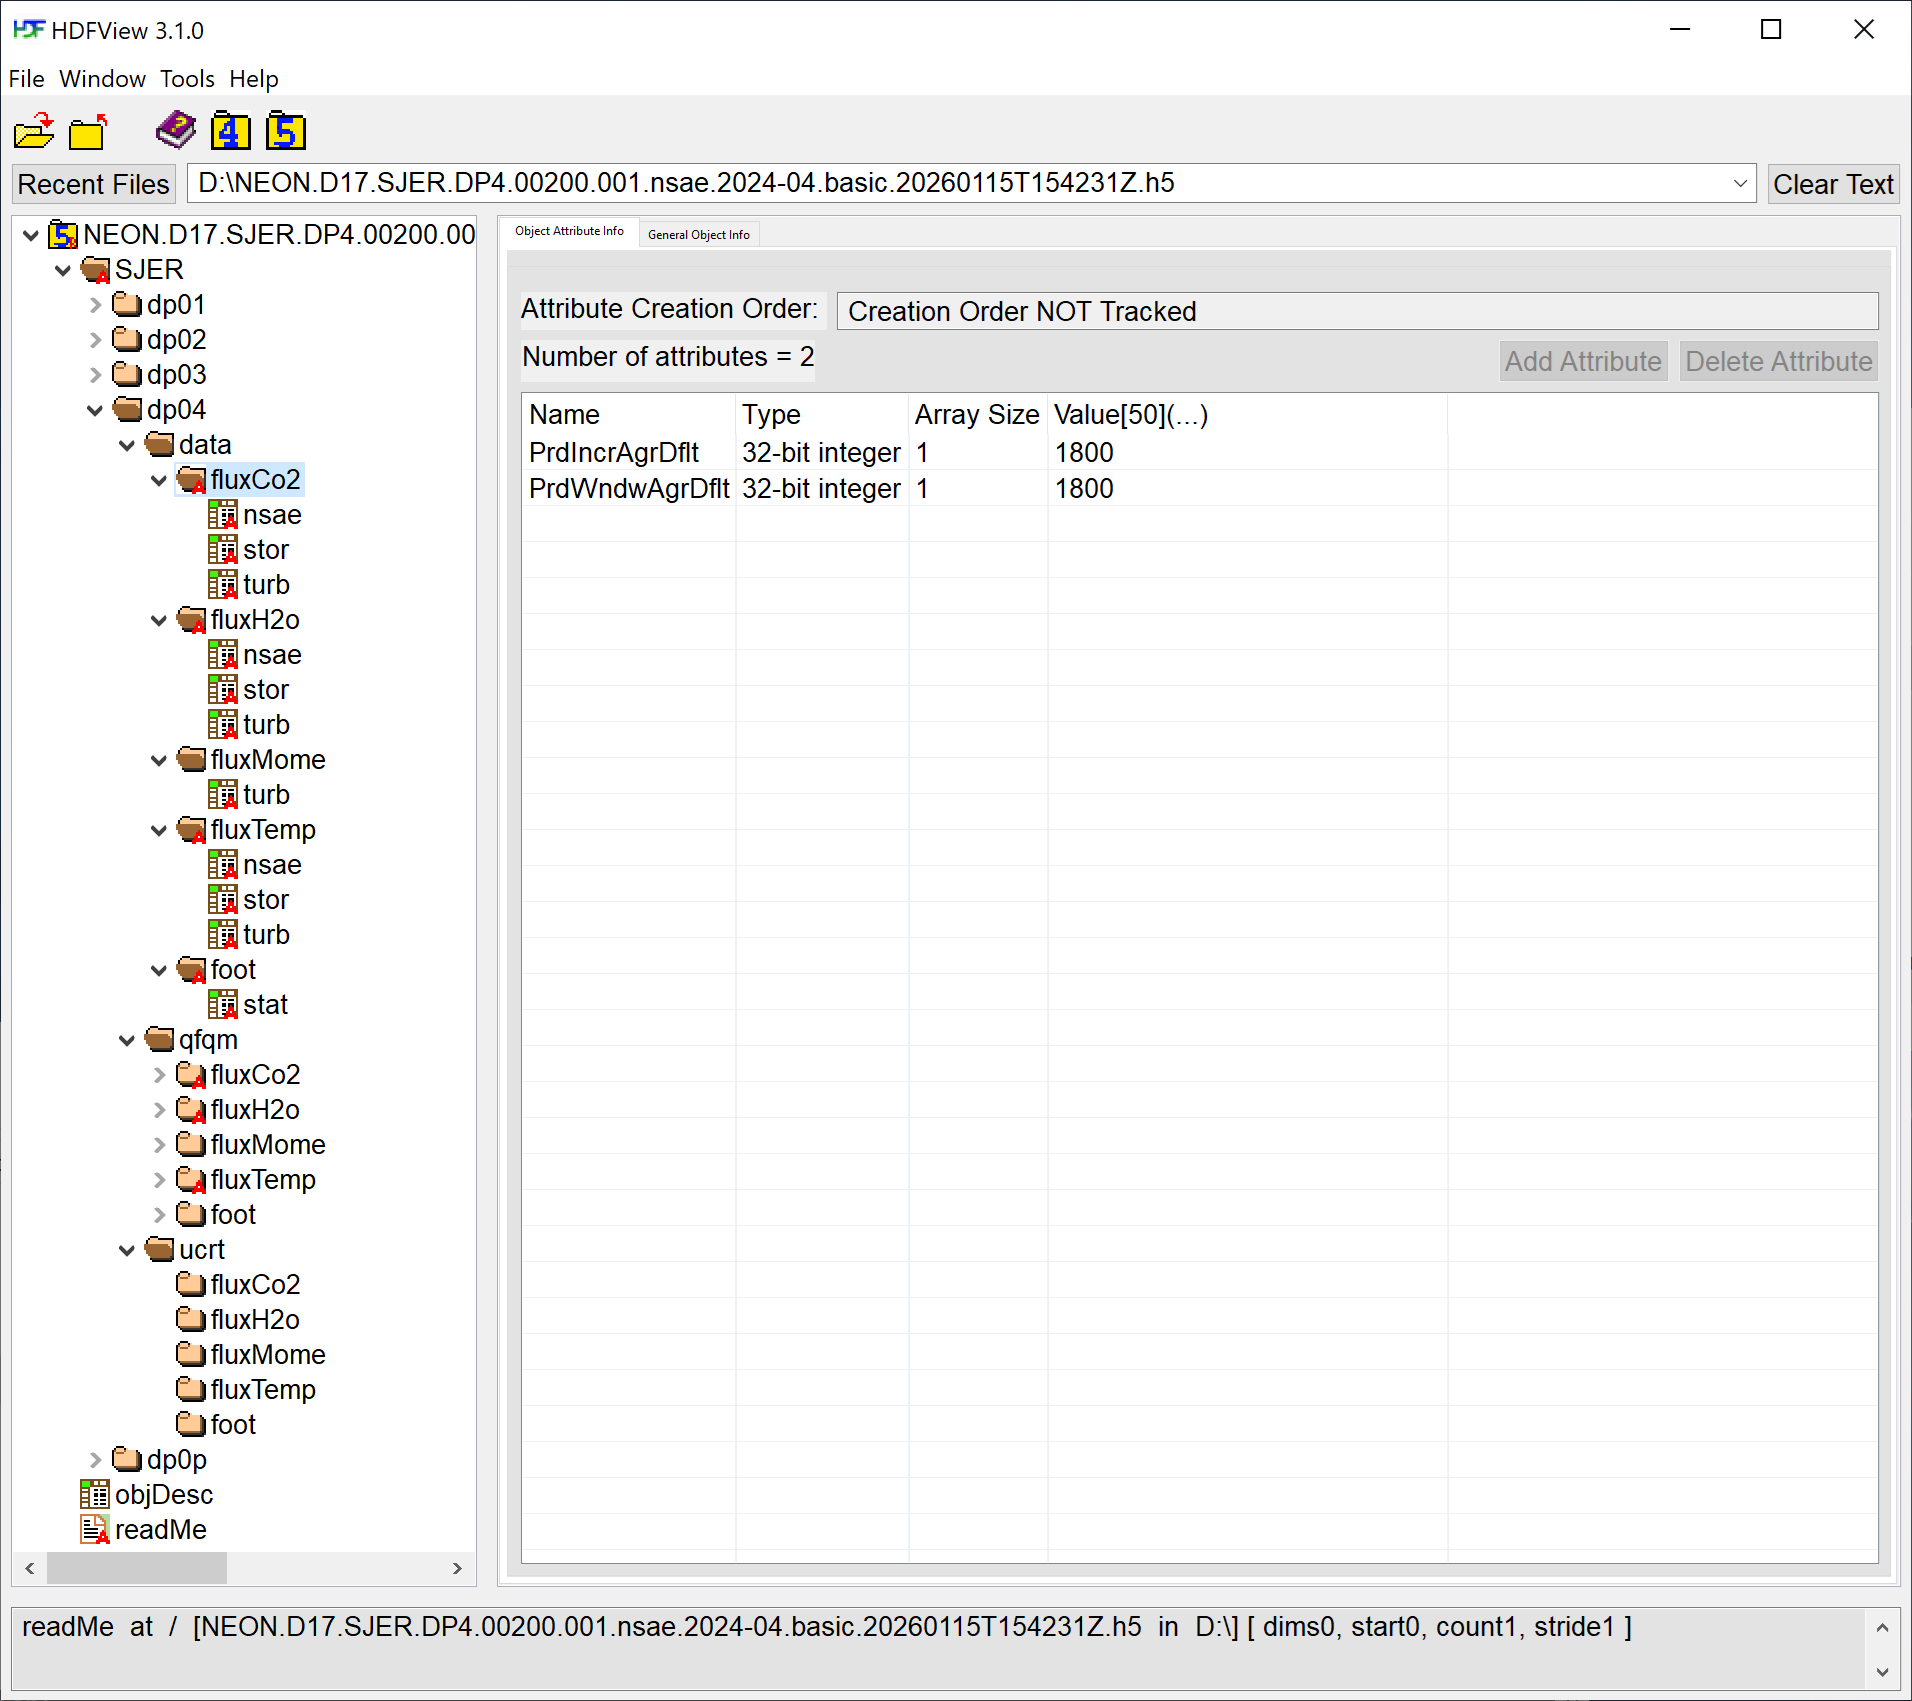
Notice that there are multiple groups (folders) under the SJER root folder starting with dp. Expand these folders by double clicking on the folder icons. These represent the different data product levels, from 01 to 04, as well as level 0 prime.
-
dp01: Level 1 -
dp02: Level 2 -
dp03: Level 3 -
dp04: Level 4 -
dp0p: Level 0 prime
Under each of the levels there is a data folder with subfolders labeled by the data product identification codes as well as quality information (qfqm) and uncertainty (ucrt). Notice that there is also metadata associated with each group.
Within the dp04/data group there are five more groups: fluxCo2, fluxH2o, fluxMome, fluxTemp, and foot. What data are contained within these groups?

So this is another example of how a NEON HDF5 file is structured. Take some time to explore this HDF5 dataset within the HDFViewer, using the reference document as needed.