Life in Motion: Understanding Aquatic Ecosystems with NEON
April 30, 2026
Water is constantly on the move: flowing across landscapes, carrying nutrients, shaping habitats and connecting ecosystems in ways that are both visible and unseen. That movement is what makes aquatic ecosystems so vital—and so challenging—to study.
Across the continental-scale network of the National Ecological Observatory Network (NEON), aquatic field sites provide a long-term, standardized view of how streams, rivers and lakes are changing over time. These systems are dynamic, influenced by everything from precipitation and land use to the physical force of water itself.

NEON Ecologist Zach Nickerson.
Zach Nickerson, a NEON-Battelle Ecologist focused on hydrology and aquatic biogeochemistry, studies these interactions every day. Zach has worked across wetlands, estuaries, rivers and streams, including research on how freshwater mussels influence nutrient cycling through their interactions with sediment. Since joining NEON in 2019, he has contributed to developing biogeochemical sampling protocols, hydrology data pipelines and data science tools that help users better understand and work with NEON’s aquatic data.
Explore aquatic data products in the NEON data portal.
In this conversation, Zach shares what makes aquatic ecosystems so complex, how NEON data enables researchers to study them at scale, and why long-term data are essential for understanding change.
A Conversation with Zach Nickerson
Can you give a high-level overview of what the aquatic systems at NEON look like?
We have 34 aquatic sites total, spread across 19 of our 20 domains. Domain 20 in Hawaii is the only Domain without an aquatic site.
Those sites include lakes, wadeable streams and larger, non-wadeable rivers. At each site, we collect a wide range of data. We have observational sampling, including water and sediment chemistry and aquatic organisms like plants, fish and invertebrates. We also have surveys, like stream morphology and lake bathymetry. And then we have continuous instrument measurements, like continuous discharge and water quality. So, it’s really a combination of different data types that all come together to describe what’s happening in these systems.
Why are aquatic ecosystems so important to understand right now? What are some of the big questions ecologists are asking?
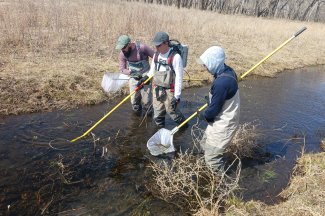
Fish sampling at Arikaree River NEON field site in Domain 10 (CO).
I think the interesting thing about aquatic ecosystems is the water itself. Water is an amazing substance. It moves, it finds its way everywhere and it connects everything.
One of the big questions in aquatic ecology right now is how changes in land use and atmospheric patterns are affecting aquatic systems. We’re seeing a lot of ecosystems across the United States becoming drier. They’re losing water more rapidly than they used to, and that has a ripple effect across the entire ecosystem. That affects things on the chemical level, like nutrient transport. It affects biological communities: algae, microbes, invertebrates, fish. And it affects the physical structure of the system, through processes like erosion and sedimentation.
Aquatic ecosystems are extremely dynamic, and because NEON is collecting data over long periods of time and across a really large spatial scale, we have this opportunity to look at those changes and understand how they play out across different ecosystems.
What makes studying aquatic systems different from studying terrestrial systems?
It really comes back to that dynamic nature of water and the amount of power it has.
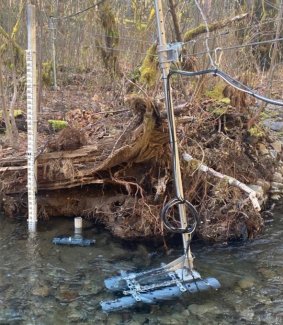
When there’s a lot of water, it can do a lot of damage. And when there’s not much water, it can still change things dramatically. That creates challenges for both the ecosystem and for us as researchers. From a practical standpoint, high flow can make it unsafe to access sites, and it can affect the infrastructure we’ve put in place. We anchor instruments in the stream, but they still have to withstand a lot of force. And we need that infrastructure to stay in place so we can maintain continuous, standardized data.
NEON has made a lot of progress in strengthening aquatic infrastructure, especially over the past several years. You can actually see that reflected in the data: we have fewer gaps, and the overall quality has improved. That’s been a big step forward.
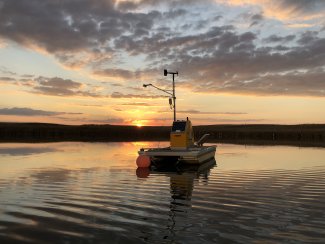
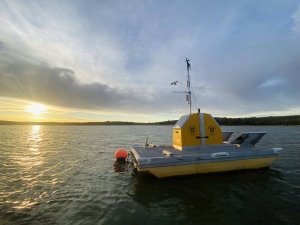
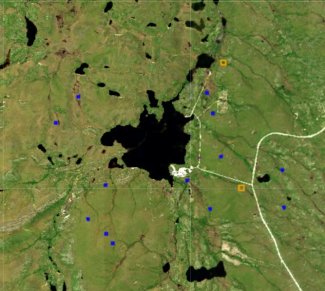
Buoy at Prairie Pothole NEON field site in D09: Northern Plains (ND). Photo by Jessie Hall, D09 Field Technician Specialist.
How were NEON aquatic sites selected, and what kinds of environments do they represent?
The NEON aquatic sites were chosen to represent a wide diversity of ecosystems across the country. That includes different latitudes and longitudes, elevations, forest structures and levels of land use. Most of the sites are in relatively pristine environments. We don’t have urban sites or heavily industrial or agricultural sites, although some are adjacent to those types of land use.
That’s one of the things that makes NEON a little different. By focusing on smaller-order streams in less disturbed systems, we can get a clearer picture of how environmental change is affecting those ecosystems.
Do you have a favorite site?
I’ve had the chance to visit a few sites, including ones in Puerto Rico and eastern Tennessee, and I really like those more biodiverse, forested ecosystems.
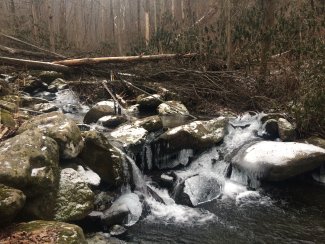
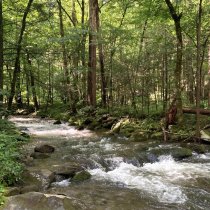
LeConte Creek NEON in D07: Appalachians & Cumberland Plateau.
If I had to pick one, it would probably be LeConte Creek NEON in Domain 07 (TN): Appalachians and Cumberland Plateau. It’s a beautiful site, but it also has a lot of power behind it. It’s at the base of a really tall mountain, and the amount of water moving through that stream is pretty incredible. It’s fun to visit, but it’s also really interesting to look at the data and see just how much water is moving through that system.
Many aquatic sites are co-located with terrestrial sites. How do those systems interact?
That’s something I’ve been especially interested in recently. When you have co-located sites, you can start to look at the entire water cycle instead of just one piece of it. You can follow water from the atmosphere, down through the terrestrial system, into the soil and groundwater, and then into the aquatic system.
Even when the sites aren’t in the exact same watershed, they’re often close enough to give you a more holistic view. It allows you to think about NEON’s aquatic sites not just as a one-kilometer reach of stream, but as part of a much larger connected system.
We recently hosted a series of webinars with the Consortium of Universities for the Advancement of Hydrologic Science, Inc (CUAHSI) on this exact topic to help researchers get started.
How do observational data and instrument data complement each other?
That’s really one of the strengths of NEON. All of the data products are standardized, both in terms of where and when the data are collected. That makes it possible to relate different types of data to each other.
You can look at biological data, like fish or macroinvertebrates, alongside sensor data that’s being collected at the same time. Or you can compare water chemistry from a grab sample to data from a high-frequency sensor.
With well-established protocols and algorithms now in place for individual data products, we can really start to focus on how to bring those data together and help people use them to answer meaningful questions.
What kinds of research questions can NEON aquatic data help answer?
One of the most interesting things is how people are combining different data products. For example, there was a study (Butler et al., 2023) that looked at stable isotopes in precipitation and compared them to isotopes in surface water. Those datasets might seem unrelated, but because of the way NEON data are collected and standardized, researchers were able to connect them. This study really reveals the power of NEON co-located terrestrial and aquatic sites to shed some light on disparately measured, but inherently linked, aspects of the water cycle.
We also see NEON data being used alongside data from other organizations like USGS and NOAA. That shows how interoperable the data are.
Because NEON collects so many different variables, the data can be really useful for things like training models or identifying relationships that might not be obvious otherwise. It gives researchers a lot of flexibility in how they approach their questions.
What excites you most about the future of the aquatics program?
What excites me the most is to see folks use the data products we have worked so hard on in their own work. Our focus on data quality and standardization pays off when researchers can easily download data products, join them together, and scale them across space and time.
Also, due to improvements in infrastructure, sampling and data products, NEON researchers can now shift our focus away from tedious data fixes and toward enabling science by thinking about how to present the data and help people use it.
There’s also been a shift toward more engagement: things like tutorials, webinars and collaborations with other organizations. I think we’re starting to see more interest in aquatic data, and that’s been really exciting.
For someone new to NEON, what’s the best way to start exploring aquatic data?
I’d say start with the NEON data portal and just explore what’s there. Look at different data products, read through the documentation, and get a feel for what’s available.
We’ve also been developing more tutorials, including some that go beyond basic data access and show how to combine datasets and look at relationships. And the openFlow application allows you to visually explore and interact with select hydrology data from our aquatic sites.
And then, honestly, just reach out. The Contact Us page is a great resource. Those questions get routed to the right people, and I think I can speak for the whole team when I say we really enjoy helping people and showing them what the data can do.