What’s the Big Deal About Continuous Discharge?
June 16, 2026
How much water is actually moving through a stream at any given moment? That question sounds simple—until you try to answer it continuously, across seasons, storms, droughts and wildly different ecosystems.
That’s what NEON’s continuous discharge data does. It tracks how flow changes over time, turning something dynamic and hard to capture into a consistent, usable record. And once you have that, you can start to understand one of the primary drivers of change in aquatic systems.
Who cares about continuous discharge?
Anyone trying to understand how rivers and streams function over time needs continuous discharge data, including water managers that track impacts of rainfall and snowmelt on ecosystems and the water supply, engineers that rely on it for design calculations, and state and local agencies that assess flooding risk.
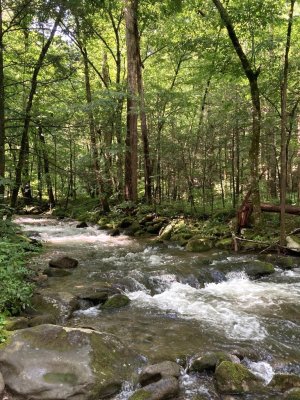
Discharge drives the physical structure of a stream. It determines how much sediment moves, how channels shift, and what types of habitats form. A high-flow year can reshape an entire system; a dry period can shrink or even eliminate it. If you’re studying geomorphology, hydrology or habitat, you need discharge data.
Flow also controls what’s happening chemically. When water moves through a watershed, it picks up nutrients, pollutants and organic material along the way. Changes in flow directly affect water quality, including turbidity and nitrogen and oxygen levels. Those measurements don’t tell the complete story without discharge.
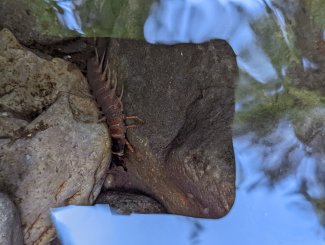
And then there’s biology. Fish, macroinvertebrates and other aquatic organisms respond quickly to changes in flow: too much water can wash them out, too little can stress or eliminate populations entirely. If you’re trying to explain why species appear, disappear or shift over time, discharge is often the missing piece.
“Discharge is really the foundation. If you’re trying to understand what’s happening in a stream—whether it’s water quality, habitat or biology—you have to start with how the water is moving.” – Nick Harrison, NEON Research Scientist, Hydrologist
NEON Continuous Discharge Data
NEON’s Continuous discharge data product provides a time series of streamflow: how much water is moving through a stream or river over time. It is one of NEON’s more complex data products, combining multiple data sources and modeling approaches into a single, continuous record that researchers can use directly. Recent updates have improved data quality and continuity, reducing gaps and making this already powerful dataset even more reliable.
Related data products available in the NEON Data Portal include:
- Continuous discharge data (streamflow time series)
- Stage-discharge rating curves (models linking water depth to flow)
- Discharge field collection (from field-based surveys)
- Salt-based stream discharge (using a constant-rate addition salt tracer)
Want to see discharge in action?
NEON’s Open Flow application lets you visualize discharge alongside precipitation and other hydrology data in just a few clicks—no preprocessing required.
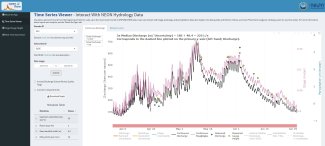
Continuous discharge data from April 1, 2025-June 30, 2025 from the BLDE field site in Domain 12 (TX) displayed in openFlow.
How does NEON Measure Continuous Discharge?
Here’s the tricky part: you can’t measure discharge continuously with a single sensor. Instead, NEON combines two approaches.
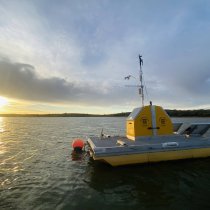
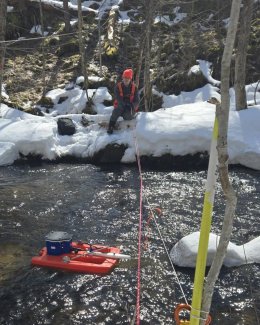
- Field teams go out regularly and take direct measurements of flow under different conditions to capture real, on-the-ground conditions at specific moments in time.
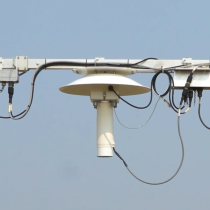
- Sensors installed in the stream measure water depth continuously. On their own, those sensors don’t tell you flow, but they do tell you how the water level is changing.
By linking field measurements to sensor data, NEON builds models that translate water depth into discharge. Those models are then applied across the full sensor record to generate a continuous time series.
Featured Study:
Using data from 22 NEON streams across the U.S., researchers found that gas exchange between water and the atmosphere increases with streamflow—but only in steeper, high-energy systems. The study highlights how discharge and stream structure work together to control key biogeochemical processes. Read the study.