
From Instrument to Insight: How NEON Builds Confidence in Ecological Data
May 29, 2026
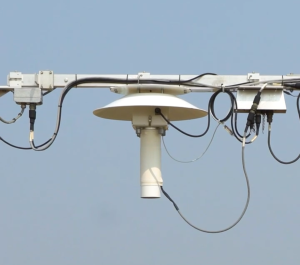
What does it take to produce ecological data that researchers can trust—not just today, but decades from now?
For the National Ecological Observatory Network (NEON), the answer begins long before data appear in the NEON Data Portal. It starts with instruments: thousands of sensors, data-gathering devices, pumps, power systems, communications components, and other pieces of hardware deployed across field sites in very different environments.
That is where the NEON Instrumentation team comes in. Led by Kim Nitschke, Instrumentation Group Manager, the team supports the hardware that makes instrumented data collection possible across terrestrial and aquatic field sites. The Instrumentation team includes three core laboratory functions: calibration and validation, repair, and engineering. Together, these laboratories help maintain the sensors, data-gathering devices and supporting equipment deployed across the Observatory. It’s all part of the ongoing effort to keep NEON measurements consistent, traceable and comparable across sites.

But as Kim is quick to point out, instrument QA/QC is not the work of one team alone. “It takes a village,” he says—or, across an Observatory as complex as NEON, “multiple villages.” That includes close coordination with Field Science, Science, Systems Integration, Cyberinfrastructure and other teams across the Observatory.
In this conversation, Kim explains why quality assurance and quality control (QA/QC) are central to NEON’s value, how instrument systems are maintained at a continental scale, and what it takes to build confidence in ecological data from the field to the data portal.
A Conversation with Kim Nitschke
What kinds of instrument systems are deployed across NEON?

NEON deploys a wide range of instruments across terrestrial and aquatic field sites. Some are standard meteorological instruments measuring things like wind speed, temperature and atmospheric conditions.
At terrestrial sites, NEON also has more complex systems that measure surface-atmosphere exchange, including carbon dioxide (CO2) flux. Instruments on towers and in soils help researchers understand gas exchange, vertical profiles around the towers, and soil conditions such as soil temperature, soil conductivity, soil moisture and soil CO2.
At aquatic sites, instruments collect measurements in streams, lakes and rivers, including water quality parameters such as turbidity and salinity.
Together, these systems collect in situ measurements of air, water and soil conditions across the Observatory.
Why is QA/QC so important for NEON instrumented data?
Quality assurance and quality control—QA/QC—is central to NEON because the Observatory is designed to produce data that can be compared across many different ecosystems, environmental conditions and time periods.
In a smaller research program, a team may be focused on one location, one set of instruments and one specific research question. NEON is different. We are collecting measurements across a continental-scale Observatory, and those measurements need to be consistent enough that researchers can compare what is happening at one field site with what is happening at another, across the entire 30-year span of the Observatory.
For NEON, QA/QC is not just a final check at the end of the process. It is built into the entire system: the engineering design, the calibration schedule, the way instruments are installed, how changes are managed, how performance is monitored and how data are reviewed before they reach users.
The goal is to provide data that are not only available but reliable, repeatable and scientifically useful over the long term.
What does that mean for NEON data users?
For data users, QA/QC creates confidence.
Researchers using NEON data need to know that measurements collected in different domains, different ecosystems and different years are being held to a common standard. That is especially important because NEON data are intended to support long-term ecological research. We are not only thinking about how the data are used today; we are also thinking about how they may be used decades from now.
When the underlying instruments are calibrated, maintained and documented in a consistent way, researchers can use those data to look for patterns across space and time. They can compare sites, combine data products, build models and ask questions that would be much harder to answer with disconnected or inconsistently collected datasets.
That is one of the core values NEON provides: open-access ecological data that users can trust at scale.
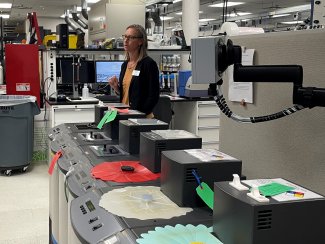
Janae Csavina, manager of the calibration, validation and audit lab, and the assembly repair lab, explains how temperature sensors are calibrated.
How does NEON maintain consistency and traceability across the Observatory?
Standardization is one of the biggest challenges and one of the most important parts of the work.
NEON cannot have one instrument suite at one field site taking measurements one way and another field site taking similar measurements in a different way. The
types of sensors we use, the way they are configured, how they are mounted and how they are calibrated all need to follow a common approach.
Traceability is another important part of that consistency. It means measurements are connected back to recognized standards. Those standards may come from organizations such as the National Institute of Standards and Technology (NIST) or the National Oceanic and Atmospheric Administration (NOAA), which provide reference materials or standards used in calibration processes.
In the laboratory, NEON uses reference standards that tie back to those external sources. That matters because the Observatory is collecting data across many different Domains and ecoclimatic regions. The goal is to make sure measurements are not only calibrated, but calibrated in a way that connects back to common, recognized standards.
Scale also matters. If we change a type of sensor or supporting component, we need to think about how that change affects the rest of the Observatory. Changes have to be implemented in a standardized, repeatable way across the network. It is a big ship to steer, but that is part of maintaining consistency at continental scale.
What does the calibration and maintenance process look like?
Instruments are brought back from the field on a regular schedule for cleaning, testing and calibration. Some sensors need calibration every year, while others may only need it every two years, depending on how they perform and how much they tend to drift over time.
When instruments arrive at the Calibration and Validation laboratory, they are first cleaned and inspected. These instruments come from real field environments, so the team needs to make sure they are ready to enter a clean laboratory setting. From there, the team tests whether they still meet operational and performance requirements. If an issue was reported in the field, the team may try to replicate that issue in the lab.
Some instruments are tested across a range of environmental conditions. Their performance is documented, and calibration information is captured before the instrument is returned to service. That process is important because sensors drift over time. Routine calibration helps bring instruments back into alignment before they are redeployed.
This work has to be carefully coordinated with field conditions, staffing, site access and other Observatory activities. There is no single quiet season across NEON. A good time to work at one field site may be the worst possible time at another, so calibration and maintenance work is coordinated throughout the year.
How does NEON respond when instruments fail, drift or become obsolete?
When an instrument comes back from the field because it is not working properly, or if it fails routine calibration, it goes through a triage process. The Repair laboratory evaluates whether it can be repaired and returned to service. If an instrument can be repaired, it goes back through calibration before returning to the field. If it cannot be repaired, it is removed from service.
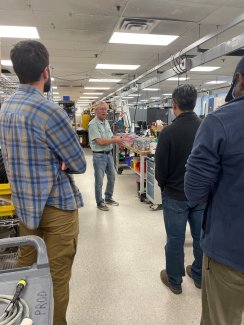
Doug Kath, NEON electrical engineer, explains to visitors how instruments are evaluated in the repair lab.
NEON also monitors instrument health while equipment is deployed. The data stream itself is only one part of what comes back from the field. NEON also collects status and health information from sensors and supporting equipment. For example, teams can monitor how much electrical current a pump is consuming, which may indicate whether it is approaching failure. That helps teams be proactive about repair or replacement.
Obsolescence is another major challenge. Manufacturers discontinue sensors or supporting components, and NEON has to find replacements that meet the same scientific and operational requirements.
One example involves pumps used in the eddy covariance systems. These pumps draw air from the tower to gas analyzer units and help maintain a constant airflow. The pumps NEON had been using since the inception of the Observatory became obsolete, so the Engineering team had to identify and validate a replacement. That was not as simple as swapping one part for another. The replacement used a different technology, moving from a rotary vane pump to a diaphragm pump. It was not the same size, did not operate in exactly the same way, and required new approaches for mounting, power, communications and control. The team had to make sure the new pump could integrate with existing infrastructure and perform comparably to the old one.
That kind of work can take considerable time, but it is essential for sustaining long-term measurements.
What do you want researchers to understand about NEON data quality?
I would like users to understand how much work happens behind the scenes to support data quality.
For NEON, valid data are about both quality and completeness. Completeness means the systems are up and running and collecting data. Quality means the data being collected are as accurate as we can make them through calibration, validation, maintenance, monitoring and other quality processes.
Those two things together create data validity. That is what NEON is working to provide to the user community.
It is also important to understand that this work involves many teams. Instrumentation is where the measurement begins, but it is only one part of the data journey. Field Science, Science, Systems Integration, Cyberinfrastructure and other teams all play a role in keeping data flowing and making sure the underlying systems are performing as expected.
The goal is to hold NEON data to a very high standard so researchers and others can use those data with confidence.