NSF NEON, Operated by Battelle

Main navigation

  • About
    • NEON Overview
      • Vision and Management
      • Spatial and Temporal Design
      • History
    • About the NEON Biorepository
      • ASU Biorepository Staff
      • Contact the NEON Biorepository
    • Observatory Blog
    • Newsletters
    • Staff
    • FAQ
    • Contact Us

    About

  • Data
    • Data Portal
      • Data Availability Charts
      • API & GraphQL
      • Prototype Data
      • Externally Hosted Data
    • Data Collection Methods
      • Airborne Observation Platform (AOP)
      • Instrument System (IS)
        • Instrumented Collection Types
        • Aquatic Instrument System (AIS)
        • Terrestrial Instrument System (TIS)
      • Observational System (OS)
        • Observation Types
        • Observational Sampling Design
        • Sampling Schedules
        • Taxonomic Lists Used by Field Staff
        • Optimizing the Observational Sampling Designs
      • Protocols & Standardized Methods
    • Getting Started with NEON Data
      • neonUtilities for R and Python
      • Learning Hub
      • Code Hub
    • Using Data
      • Data Formats and Conventions
      • Released, Provisional, and Revised Data
      • Data Product Bundles
      • Usage Policies
      • Acknowledging and Citing NEON
      • Publishing Research Outputs
    • Data Notifications
    • NEON Data Management
      • Data Availability
      • Data Processing
      • Data Quality

    Data

  • Samples & Specimens
    • Biorepository Sample Portal at ASU
    • About Samples
      • Sample Types
      • Sample Repositories
      • Megapit and Distributed Initial Characterization Soil Archives
    • Finding and Accessing Sample Data
      • Species Checklists
      • Sample Explorer - Relationships and Data
      • Biorepository API
    • Requesting and Using Samples
      • Loans & Archival Requests
      • Usage Policies

    Samples & Specimens

  • Field Sites
    • Field Site Map and Info
    • Spatial Layers & Printable Maps

    Field Sites

  • Resources
    • Getting Started with NEON Data
    • Research Support Services
      • Field Site Coordination
      • Letters of Support
      • Mobile Deployment Platforms
      • Permits and Permissions
      • AOP Flight Campaigns
      • Research Support FAQs
      • Research Support Projects
    • Code Hub
      • neonUtilities for R and Python
      • Code Resources Guidelines
      • Code Resources Submission
      • NEON's GitHub Organization Homepage
    • Learning Hub
      • Tutorials
      • Workshops & Courses
      • Science Videos
      • Teaching Modules
    • Science Seminars and Data Skills Webinars
    • Document Library
    • Funding Opportunities

    Resources

  • Impact
    • Research Highlights
    • Papers & Publications
    • NEON in the News

    Impact

  • Get Involved
    • Upcoming Events
    • Research and Collaborations
      • Environmental Data Science Innovation and Inclusion Lab
      • Collaboration with DOE BER User Facilities and Programs
      • EFI-NEON Ecological Forecasting Challenge
      • NEON Great Lakes User Group
      • NCAR-NEON-Community Collaborations
    • Advisory Groups
      • Science, Technology & Education Advisory Committee
      • Technical Working Groups
    • NEON Ambassador Program
      • Exploring NEON-Derived Data Products Workshop Series
    • Partnerships
    • Community Engagement
    • Work Opportunities

    Get Involved

  • My Account
  • Search

Search

About

  • NEON Overview
  • About the NEON Biorepository
  • Observatory Blog
  • Newsletters
  • Staff
  • FAQ
  • Contact Us

Breadcrumb

  1. About
  2. Observatory Blog
  3. Tracking isotopes to illuminate Nature's grand recycling program

Tracking isotopes to illuminate Nature's grand recycling program

January 22, 2013

By David Hoekman

dead zones in marine systems far from the original field. Before becoming the insect ecologist at NEON, I worked on a project

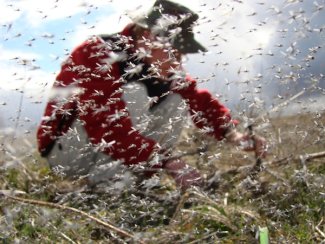
Mývatn – “lake of midges” in Icelandic) in 2008-2009 to be greater than 79 tons dry weight. This represents hundreds of billions of individual midges, a greater biomass than two gray whales, and a potential nutrient export to land of eight tons of nitrogen and one ton of phosphorus. Near-shore areas may receive enough midges to effectively be fertilized up to 10 times the background rates of nitrogen inputs. These tiny midges transport an incredible amount of nutrients from water to land via their own bodies. The movement of biomass and nutrients across ecosystem boundaries can have major effects in the recipient system. This is where isotope tracking comes in handy. You may have heard of paleontologists using radioactive carbon-14 to determine the age of a fossil. Stable (non-radioactive) isotopes like carbon-13 are powerful tools for tracking the movement and cycling of nutrients through ecosystems. Isotopes are versions of atoms that contain different numbers of neutrons and therefore weigh different amounts. When scientists measure stable isotopes they are looking for the ratio of heavy to light atoms. The isotope ratio of an animal can tell you about what they have been eating because when it comes to C isotopes, you literally are what you eat. For example, midges have a carbon isotope ratio that is the same as the aquatic plants they eat (they eat only as larvae in the water, not as adults). But insects that live on land have a carbon isotope ratio that reflects their terrestrial plant food sources, which happen to be very different from aquatic plants (for reasons we don’t have time to get into here). So when we look at the carbon isotope ratio in land predators like spiders, we can determine what proportion of their diet came from aquatic sources (in this case midges) versus terrestrial sources (land-living insects). My University of Wisconsin colleagues and I used carbon isotope ratios to trace midge nutrients through the food web and determine what organisms were feeding on midges and where those nutrients ended up in the system. In a recent paper, we showed that the input of midges from aquatic systems is very important for maintaining robust terrestrial food webs near water. Our carbon isotope measurements showed that midge nutrients enter terrestrial plants and animals soon after midges arrive. Detritivores

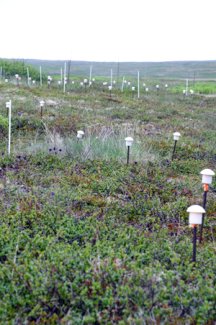
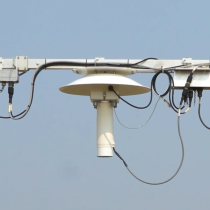
water cycles among plants, ground water, surface water and the atmosphere in a local ecosystem. Oxygen and hydrogen isotopes in precipitation at multiple sites can indicate where your water comes from and how it cycles at regional and continental scales. The water cycle regulates global and local precipitation patterns with major implications for agriculture and natural resources like drinking water. Understanding changes in the water cycle is a critical part of NEON’s mission to track and forecast environmental change. Ecosystems cannot be understood in isolation because of the important influence of organisms and nutrients that move between adjacent systems. At NEON we’re intentionally taking a landscape scale view of ecosystems. Measuring isotopes at each local NEON site will enable us to synthesize the interconnected processes of environmental change at the landscape scale. Just as the isotopes in midges helped us to understand the movement of nutrients in a local food web, the isotopes in water, air and soil at NEON sites will enable us to better understand the movement of nutrients within and among ecosystems across the continent.

Share

Related Posts:

Discontinuation of Select NEON Data Products

January 29, 2026

Modification of Select NEON Data Products

January 29, 2026

Pilot Results and Updated Methodology - mosquito pathogen status (DP1.10041.001)

October 30, 2025

NSF NEON, Operated by Battelle

Follow Us:

Join Our Newsletter

Get updates on events, opportunities, and how NEON is being used today.

Subscribe Now

Footer

  • About Us
  • Contact Us
  • Terms & Conditions
  • Careers
  • Code of Conduct

Copyright © Battelle, 2026

The National Ecological Observatory Network is a major facility fully funded by the U.S. National Science Foundation.

Any opinions, findings and conclusions or recommendations expressed in this material do not necessarily reflect the views of the U.S. National Science Foundation.