The Power of Networked Science
November 9, 2018

By Sharon Collinge, Past Observatory Director and Chief Scientist
Several long-term national and international science networks such as the Long-Term Ecological Research Network (LTER), the Critical Zone Observatory (CZO), AmeriFlux and GLEON are driving a deeper understanding of environmental processes and systems. But how can these networks complement and reinforce each other? And how does the NEON project fit in among these established networks?
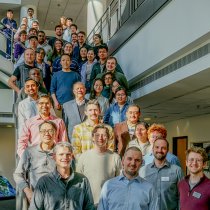
Recently, I had the opportunity to reflect on these questions at meetings for CZO and LTER. The Southern Sierra CZO annual team meeting, held on October 17, brought together project scientists to discuss findings from their four major study areas on the western slope of the southern Sierra Nevada, one of which is co-located with the NEON Soaproot Saddle (SOAP) field site. The LTER All-Scientists Meeting, which is held every three years, took place September 30 – October 4. Hundreds of scientists representing LTER sites across the network gathered in Pacific Grove, California to share discoveries, progress, ideas and best practices.
Both of these meetings drove home the tremendous value that these networks, and the more collaborative and cross-disciplinary approach to science that they represent, bring to the field of ecology. They also gave me more insight into the ways that the NEON project is already becoming integrated into their work and the opportunities we have for collaboration across the next years and decades.
The How and the Why of Changing Ecosystems
There are some distinct differences in the way that the NEON project is designed compared to these other long-term networks.
- LTER and CZO, in particular, are investigator-driven and engaged in both observational and experimental research. Typically, they are focused on a diverse set of place-based research questions designed to understand long-term ecosystem dynamics.
- The NEON project is designed to gather standardized ecological data from the soil to the atmosphere that are comparable across broad geographic areas and long timescales. We gather a broad spectrum of data products that can be used by the scientific community to investigate many different types of ecological questions.
These complementary approaches have great potential for productive synergies. As Julia Jones and her coauthors explain in a paper soon to be published in BioScience, the NEON project is focused on how ecological systems are changing, while networks such as LTER and CZO are investigating why.
Eight NEON field sites are co-located with LTER sites, including seven current LTER sites and one historical site. Two NEON sites are co-located with CZO sites. In places where LTER and CZO sites are co-located with NEON field sites, NEON provides a range of data products that can provide additional context and insights for the research questions they are exploring. Where NEON data products overlap with data produced by these networks, there is an opportunity for researchers to obtain comparative data from other NEON sites where there is not another strong local research presence. At the same time, networks like CZO and LTER are bringing NEON data to life by incorporating these observations into hypothesis-driven investigations of specific ecological processes.
Together, these two complementary approaches to science are amplifying the power of each of the networks and enabling a deeper and more nuanced understanding of how ecological systems are linked across time and space.
Building a Network of Networks
The connections between the NEON project and other networks are already starting to yield exciting results. A February meeting between NEON, LTER/ILTER, CZO and the International Soil Modeling Consortium (ISMC) has resulted in several papers exploring synergies among the groups and a number of shared research projects.
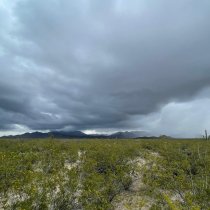
These conversations were continued at the recent meetings of LTER and CZO. Interestingly, the Soaproot Saddle/Southern Sierra site, shared by the NEON project and CZO, is considered to be the epicenter of tree mortality related to the 2012-2016 "mega-drought" in California. CZO investigators are studying tree die-off patterns due to extreme draw-down of deep soil water and relating these patterns to above-ground and below-ground plant, animal and microbe communities. The Soaproot NEON field site came on board during the drought and will provide an important source of ecological data for scientists looking at the long-term effects on local ecosystems.
A number of LTER researchers are already incorporating NEON data into their work to supplement the data furnished by LTER or to provide comparative data from similar ecosystems. The NEON project's unique combination of terrestrial and aquatic observations, flux tower data and airborne remote sensing data provides significant value for LTER scientists. Potential areas of synergy identified by scientists at LTER and the NEON project include carbon and energy fluxes, ecosystem modeling, fluxes between aquatic and terrestrial ecosystems, soil biogeochemistry, and studies of land use changes and ecosystem resilience.
Through these and other collaborations, a "network of networks" is emerging in ecology that encompasses not just infrastructure and data but also people. I am excited by the possibilities I see emerging from the CZO and LTER meetings. I look forward to continuing discussions among researchers in these networks and finding more ways in which we can support and magnify each other's efforts.