NSF NEON, Operated by Battelle

Main navigation

  • About
    • NEON Overview
      • Vision and Management
      • Spatial and Temporal Design
      • History
    • About the NEON Biorepository
      • ASU NEON Biorepository Staff
      • Contact the NEON Biorepository
    • Observatory Blog
    • Newsletters
    • Staff
    • FAQ
    • User Accounts
    • Contact Us

    About

  • Data
    • Data Portal
      • Data Availability Charts
      • API & GraphQL
      • Prototype Data
      • Externally Hosted Data
    • Data Collection Methods
      • Airborne Observation Platform (AOP)
      • Instrument System (IS)
        • Instrumented Collection Types
        • Aquatic Instrument System (AIS)
        • Terrestrial Instrument System (TIS)
      • Observational System (OS)
        • Observation Types
        • Observational Sampling Design
        • Sampling Schedules
        • Taxonomic Lists Used by Field Staff
        • Optimizing the Observational Sampling Designs
      • Protocols & Standardized Methods
    • Getting Started with NEON Data
      • neonUtilities for R and Python
      • Learning Hub
      • Code Hub
    • Using Data
      • Data Formats and Conventions
      • Released, Provisional, and Revised Data
      • Data Product Bundles
      • Usage Policies
      • Acknowledging and Citing NEON
      • Publishing Research Outputs
    • Data Notifications
    • NEON Data Management
      • Data Availability
      • Data Processing
      • Data Quality

    Data

  • Samples & Specimens
    • Biorepository Sample Portal at ASU
    • About Samples
      • Sample Types
      • Sample Repositories
      • Megapit and Distributed Initial Characterization Soil Archives
    • Finding and Accessing Sample Data
      • Species Checklists
      • Sample Explorer - Relationships and Data
      • Biorepository API
    • Requesting and Using Samples
      • Loans & Archival Requests
      • Usage Policies

    Samples & Specimens

  • Field Sites
    • Field Site Map and Info
    • Spatial Data Layers & Maps

    Field Sites

  • Resources
    • Getting Started with NEON Data
    • Research Support Services
      • Field Site Coordination
      • Letters of Support
      • Permits and Permissions
      • AOP Flight Campaigns
      • Research Support FAQs
      • Research Support Projects
    • Code Hub
      • neonUtilities for R and Python
      • Code Resources Guidelines
      • Code Resources Submission
      • NEON's GitHub Organization Homepage
    • Learning Hub
      • Tutorials
      • Workshops & Courses
      • Science Videos
      • Teaching Modules
    • Science Seminars and Data Skills Webinars
    • Document Library
    • Funding Opportunities

    Resources

  • Impact
    • Research Highlights
    • Papers & Publications
    • NEON in the News

    Impact

  • Get Involved
    • Upcoming Events
    • Research and Collaborations
      • Environmental Data Science Innovation and Inclusion Lab
      • Collaboration with DOE BER User Facilities and Programs
      • EFI-NEON Ecological Forecasting Challenge
      • NEON Great Lakes User Group
      • NCAR-NEON-Community Collaborations
    • Advisory Groups
      • Science, Technology & Education Advisory Committee (STEAC)
      • Innovation Advisory Committee (IAC)
      • Technical Working Groups (TWG)
    • NEON Ambassador Program
      • Exploring NEON-Derived Data Products Workshop Series
    • Partnerships
    • Community Engagement
    • Work Opportunities

    Get Involved

  • My Account
  • Search

Search

About

  • NEON Overview
  • About the NEON Biorepository
  • Observatory Blog
  • Newsletters
  • Staff
  • FAQ
  • User Accounts
  • Contact Us

Breadcrumb

  1. About
  2. Observatory Blog
  3. New visualization tool for surface-atmosphere exchange data

Data Notification

New visualization tool for surface-atmosphere exchange data

May 7, 2026

NEON has released a new Surface–Atmosphere Exchange (SAE) Data Visualization Tool. This tool provides a quick, interactive view of fluxes and key meteorological drivers. Users can preview time series, QC information, and site-level patterns before downloading data.

screenshot of SAE visualization tool

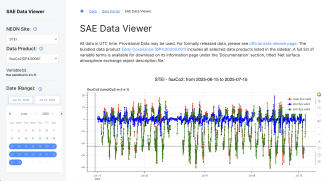
NEON CO2 flux data from Steigerwaldt-Chequamegon NEON field site (STEI), June 15 - July 15, 2025

Data products visualized in the tool include:

Variable in SAE Data Viewer Related Data Product(s)
fluxCO2 Carbon dioxide flux (DP4.00067.001)
fluxH2O Latent heat flux (DP4.00137.001)
fluxTemp Sensible heat flux (DP4.00002.001)
CH4 CH4 Concentration (DP1.00030.001)
CO2 CO2 concentration (turbulent) (DP1.00034.001), Atmospheric CO2 isotopes (DP1.00036.001), or CO2 concentration (storage) (DP1.00099.001)
H2O H2O concentration (turbulent) (DP1.00035.001), Atmospheric H2O isotopes (DP1.00037.001), or H2O concentration (storage) (DP1.00100.001)
isoCO2  Atmospheric CO2 isotopes (DP1.00036.001)
isoH2O Atmospheric H2O isotopes (DP1.00037.001)
tempTriple Triple aspirated air temperature (DP1.00003.001)
windSpeed 3D wind speed, direction, sonic temperature (DP1.00007.001), Momentum flux (DP4.00007.001)

No changes have been made to the underlying data products. 

There are multiple entry points to the new viewer:

  • Select the SAE Data Viewer filter under Visualizations in the left filter bar of the Data Portal, and then click on the SAE Data Viewer button in one of the relevant data product cards, or
  • In an SAE data product detail page, scroll to the bottom of the page and click on the SAE Data Viewer button, or
  • Visit https://data.neonscience.org/visualizations/sae-visualization directly.

Your feedback is welcome as we will continue to incorporate enhancements over time - please let us know through the Contact Us form. 


Share

Related Posts:

NEON Live: Connecting Flux Data, Remote Sensing and AI

May 7, 2026

Group photo of attendees of the 2026 remote sensing and fluxes workshop.

Life in Motion: Understanding Aquatic Ecosystems with NEON

April 30, 2026

Buoy at the Prairie Pothole NEON aquatic site

Biology, sediment chemistry, and groundwater chemistry sampling windows for all aquatic sites updated

April 6, 2026

NSF NEON, Operated by Battelle

Follow Us:

Join Our Newsletter

Get updates on events, opportunities, and how NEON is being used today.

Subscribe Now

Footer

  • About Us
  • Contact Us
  • Terms & Conditions
  • Careers
  • Code of Conduct

Copyright © Battelle, 2026

The National Ecological Observatory Network is a major facility fully funded by the U.S. National Science Foundation.

Any opinions, findings and conclusions or recommendations expressed in this material do not necessarily reflect the views of the U.S. National Science Foundation.