Getting Started: What New Users Should Know About NEON Data
June 30, 2026
NEON data are free, open and designed to support ecological discovery at a continental scale. For new users, that scale is part of the value: NEON offers standardized data across varied ecosystems, including remote sensing data, instrumented measurements, observational sampling data and physical specimens from sites across the United States. But it can also raise a practical question: where should I start?

That is where Dr. Christine Laney comes in. Christine is a data scientist and NEON’s Informatics Lead, where she leads development of the NEON Data Portal and helps make NEON data easier to find, understand and use. Her work focuses on making ecological and environmental data more accessible for broad audiences and interoperable with other data networks.
We caught up with Christine about how new users should approach NEON data. Her advice: start with your question, explore the tools NEON has built and do not hesitate to ask for help.
Ready to dive in? Start here: Getting Started with NEON Data
Watch the Quick Start video: https://www.youtube.com/watch?v=gaA_duzWnvk
A Conversation with Christine Laney
For someone coming to NEON for the first time, what should they understand before diving into the data?
NEON is a unique research infrastructure designed to support ecological research at a scale that would be difficult for individual researchers or institutions to achieve on their own. Across field sites in the United States, NEON collects standardized data from many different types of ecosystems over a long period of time.
That standardization is important. Because NEON data are collected using consistent methods across sites and over time, researchers can use them to look at ecological patterns and processes in depth, compare different ecosystems and ask questions that span regions, disciplines and decades.
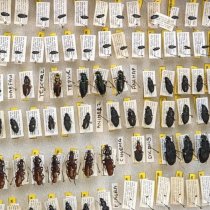
New users should also know that NEON data are broad. The Observatory collects airborne remote sensing data, data from thousands of instruments placed at field sites, human-collected observational data on organisms and biogeochemical processes, and physical specimens archived through the NEON Biorepository. That breadth creates a lot of opportunities, but it also means there may be more than one way to approach a research question.
Who can use NEON data?
Anyone can use NEON data. They are free and open, and they are available to researchers, educators, students, data scientists and others interested in working with ecological data.
NEON data are being used in many different ways. Some researchers use them for research within a site, where the many types of data collected in the same place can lead to deeper understanding. Others use NEON data to study regional processes or explore questions across multiple ecosystems and time periods.
NEON data are also used in teaching and training. Educators use them to help students learn how to work with large ecological datasets, and data science and AI researchers are using them to test ideas related to cloud-based, AI-supported workflows and large-scale model development.
Where should a new user start?
NEON offers several entry points.
- NEONscience.org provides the broad orientation: what NEON is, where field sites are located, how data are collected and what kinds of data, samples and learning resources are available.
- Getting Started with NEON Data provides a good overview. You’ll also find a lot of information on our FAQ page.
- The field site pages and interactive map can help users explore what is available at a particular location.
- The NEON Data Portal allows users to search the data catalog by theme, data type, variable or keyword.
- The Sample Portal provides access to physical specimens archived through the NEON Biorepository.
- We also provide tutorials and science videos on our Learning Hub.
And if you get stuck, ask. NEON’s Contact Us form creates a support ticket that is routed to the right person to help you.
What resources are available to help new users learn their way around NEON data?
NEON offers a range of educational resources for users who want to explore at their own pace or build more specific data skills.
A good place to begin is the Learning Hub, which brings together resources such as science videos, tutorials, workshops and courses. The tutorials are designed for hands-on learning, from basic skills such as downloading and plotting NEON data to more advanced analyses across multiple data products. Videos include short introductions to NEON data collection methods as well as science seminars and recordings of training workshops.
Users can also look for upcoming webinars, workshops, conference sessions and other opportunities through NEON’s events listings. These can be especially helpful for people who want direct interaction with NEON staff.
What is the easiest way to start exploring NEON data?
You do not have to download a dataset right away to start understanding what NEON has to offer. For many new users, the easiest first step is to explore visually.
The field site pages and interactive site map are a good place to begin if you are interested in a particular location. Users can zoom in to see where NEON sites are located, view site boundaries, explore land cover and see details such as watershed boundaries, airborne remote sensing flight boxes and sampling plots. From there, users can move into pre-filtered data products or samples associated with that site.
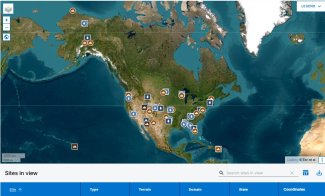
The interactive field site map enables users to zoom in to see where NEON sites are located, view site boundaries, explore land cover and see details such as watershed boundaries, airborne remote sensing flight boxes and sampling plots.
Before downloading data, new users can use the Product Details pages available for each data product in the Data Portal. In addition to general information about the data products, these often have quick start guides and data visualization tools.
Visualization tools are embedded in the Data Portal to allow users to explore selected data before working directly with files. Users can view time series of sensor data, explore surface-atmosphere exchange data or use Google Earth Engine resources to visualize remote sensing data. These tools can help new users get a feel for what is available and decide which data products may be most useful for their research or teaching.
Once users find a data product that looks relevant, how can they understand what they are looking at?
The Product Details page is one of the most useful places to start. Each data product has extensive documentation available right inside the Data Portal.
For new users, the quick start guide (found on the details page for each product) can be especially helpful. These guides provide a short, accessible overview of the data product and how it can be used. The Details pages also link to much more extensive documentation for more in-depth understanding of data collection and processing.
What should users know about downloading and citing NEON data?
Once you are ready to download data, the NEON Data Portal provides the information you need to cite those data correctly. Each data product page includes a citation box with the recommended citation, and users can download that citation in different formats for use in publications, reports or other research outputs.
Please note: NEON updated its data license. Going forward, downloaded data will require attribution, which means users will need to acknowledge NEON as the creator when they use the data. Data downloaded before this change remain under the previous Creative Commons Zero (CC0) license.
Find citation guidelines and information on using NEON data: https://www.neonscience.org/data/using-data.
Do users need to log in to use or download NEON data?
You can explore NEON data without logging in. Users can browse data products, review data availability, read documentation and use visualization tools to better understand what is available.
However, as of June 30th, users will need to log in to download data. You’ll be asked to create an account or authenticate when downloading files through the Data Portal, API or web services.
This change is intended to help NEON manage data access fairly and responsibly while keeping the data open. Creating an account is simple, and access remains free.
What should users do if they get stuck?
Reach out. NEON data can be complex, especially for users who are new to the Observatory, but you do not have to figure everything out alone.
If you are looking through the website or Data Portal and cannot find what you need, feel free to use the Contact Us form. It creates a support ticket that can be routed to the right person to help you.