Data Notification
New Data Product: Canopy Nitrogen, Subset of Data Available for Community Review
February 26, 2026
The NEON Airborne Observation Platform (AOP) is currently developing data products that map canopy nitrogen content (%) across all NEON terrestrial sites. These data products link georeferenced foliar samples collected by NEON’s Terrestrial Observation System (TOS) teams with NEON’s 1-meter airborne imaging spectroscopy surface reflectance data product (DP1.30006.001). Foliar samples are collected once every five years at each terrestrial site to measure various biophysical and biochemical leaf traits, including carbon and nitrogen content, leaf mass per area, leaf water content, chlorophyll concentration, stable isotopes, and major and minor elements. These measurements are included in the Plant Foliar Trait data product (DP1.10026.001). As of Release 2026, NEON has collected a total of 2,666 foliar samples from both woody plants and herbaceous cover across all its terrestrial sites (Figure 1). This sampling began in 2016.
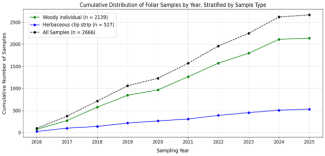
Figure 1: The total number of foliar samples collected by NEON across its 47 terrestrial sites. We have not yet received foliar chemistry measurements for the 2025 foliar samples from many of our sites' laboratories.
As part of our upcoming Release 2027 (expected by the end of January 2027), NEON plans to introduce two new sets of data products focused on canopy nitrogen and lignin concentrations. In advance of this official release, we aim to create maps of foliar nitrogen concentrations (%) for a select set of candidate sites, as detailed in Table 1. We hope to solicit valuable feedback from the user community on this initiative. These maps can be downloaded from the NEON data portal (DP3.30018.002).
Table 1: List of candidate sites with available canopy nitrogen concentration (%) maps.
| Domain | Site | Year | |
|---|---|---|---|
| 1. | D01 | Harvard Forest (HARV), MA | 2019 |
| 2. | D02 | Smithsonian Conservation Biology Institute (SCBI), VA | 2017 |
| 3. | D06 | University of Kansas Field Station (UKFS), KS | 2020 |
| 4. | D07 | Mountain Lake Biological Station (MLBS), VA | 2021 |
| 5. | D10 | North Sterling (STER), CO | 2021 |
| 6. | D10 | Central Plains Experimental Range (CPER), CO | 2021 |
| 7. | D13 | Moab (MOAB), UT | 2021 |
| 8. | D16 | Wind River Experimental Forest (WREF), WA | 2021 |
| 9. | D17 | San Joaquin Experimental Range (SJER), CA | 2021 |
| 10. | D17 | Soaproot Saddle (SOAP), CA | 2018 |
| 11. | D19 | Healy (HEAL), AK | 2021 |
Methodology
We developed generalizable predictive models of percent nitrogen (%N) at 47 NEON terrestrial sites across the United States by combining level-1 1-m-resolution airborne imaging spectroscopy with ground-based measurements of %N from sunlit leaves that spatially and temporally overlap with the imagery. Accurate modeling requires precise spatial alignment of field and airborne data. From 2020 onward, crowns of sampled vegetation individuals were digitized in the field using previously collected AOP imagery, generating shapefiles that allow precise georeferencing. Where digitized tree crowns were unavailable, field-measured tree crown widths were used to approximate crown extents.
Image spectra were extracted within sampling bounds for all tree crowns and herbaceous-clip strips across the 47 terrestrial field sites. We removed the noisy and atmospheric absorption bands, retaining the spectral regions 418.59-1335.04 nm, 1460.23-1770.72 nm, and 1986.06-2396.71 nm. To reduce the effects of internal canopy shade, we brightness-normalized the spectra by dividing the reflectance at each wavelength by the full-spectrum reflectance norm. The spectra were then divided into training, validation, and test sets using stratified sampling to ensure proportional geographic representation. To address the class imbalance between woody and herbaceous cover spectra, we applied crown-specific subsampling, which limited the number of pixels sampled per crown to five.
A Support Vector Machine (SVM) classifier, trained on spectra from foliar samples across all terrestrial field sites and years, categorized vegetation into "needle" and "non-needle" types, achieving an overall accuracy of 96.6%. The aim is to apply different regression models for each vegetation type. We constructed a 100-model ensemble of regression models, which included Random Forest, Support Vector, and Partial Least Squares, to predict % N using 327 reflectance bands. Among these, Random Forest models delivered the best performance. Generalized Random Forest regression models were trained separately for needle and non-needle vegetation. Preliminary results indicate a promising capability to predict foliar nitrogen from NEON data collected in both field and airborne contexts, with an R² of 0.52 and RMSE of 0.46 (Figures 2 and 3). We plan to extend this analysis to include additional traits (i.e. lignin).
We have finished implementing the Bidirectional Reflectance Distribution Function (BRDF) and topographic corrections to the recently collected airborne optical (AOP) hyperspectral data from 2022 to 2025. We are currently applying these corrections to hyperspectral data collected from 2013 to 2021. Once we finish processing the earlier data, we will use the corrected bi-directional reflectance to generate foliar trait maps. However, the preliminary maps provided here were created using uncorrected (directional) surface reflectance flight lines (DP1.30006.001). Additionally, the models (Support Vector Machine and Random Forest) were trained on this directional reflectance data.
Data Format
For each site listed in Table 1, maps for %N are provided as 1 x 1 km tiles in .tif format. Additionally, a mosaicked %N map covering all tiles within each site is available. Each .tif file includes the following additional layers:
- %N uncertainty map: This map shows the uncertainty associated with the %N predictions. It is calculated by taking the standard deviation of the %N predictions from each decision tree in the random forest model for each 1 m pixel within the tile.
- Needle and Non-Needle Types Map: This is a binary map generated using SVM classification, where “needle” types are coded as 0 and “non-needle” types as 1 for each 1 m pixel within the tile.
- NDVI Mask: An NDVI-based mask is included to exclude non-vegetated areas, such as roads, water bodies, built-up areas, snow, and bare rock.
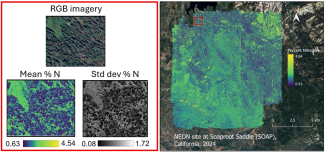
Figure 2: A mosaic of % N predictions for the Soaproot Saddle site for the year 2024.
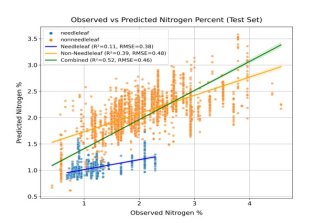
Figure 3: Separate random forest models were developed for needleleaf and non-needleleaf foliar samples. This separation improved the overall prediction accuracy.
Providing Feedback
For a hands-on introduction to working with the Canopy Nitrogen data product, please see the Python tutorial Introduction to the Canopy Nitrogen Data Product.
If you wish to provide feedback, please use NEON’s Contact Us Form, direct to Staff Member “Shashi Konduri” and include the words “Canopy Nitrogen” in your Comment/Question.